
Click Here if you listened. We’d love to know what you think. There is even a spot for feedback! Read along below!
Stress Management
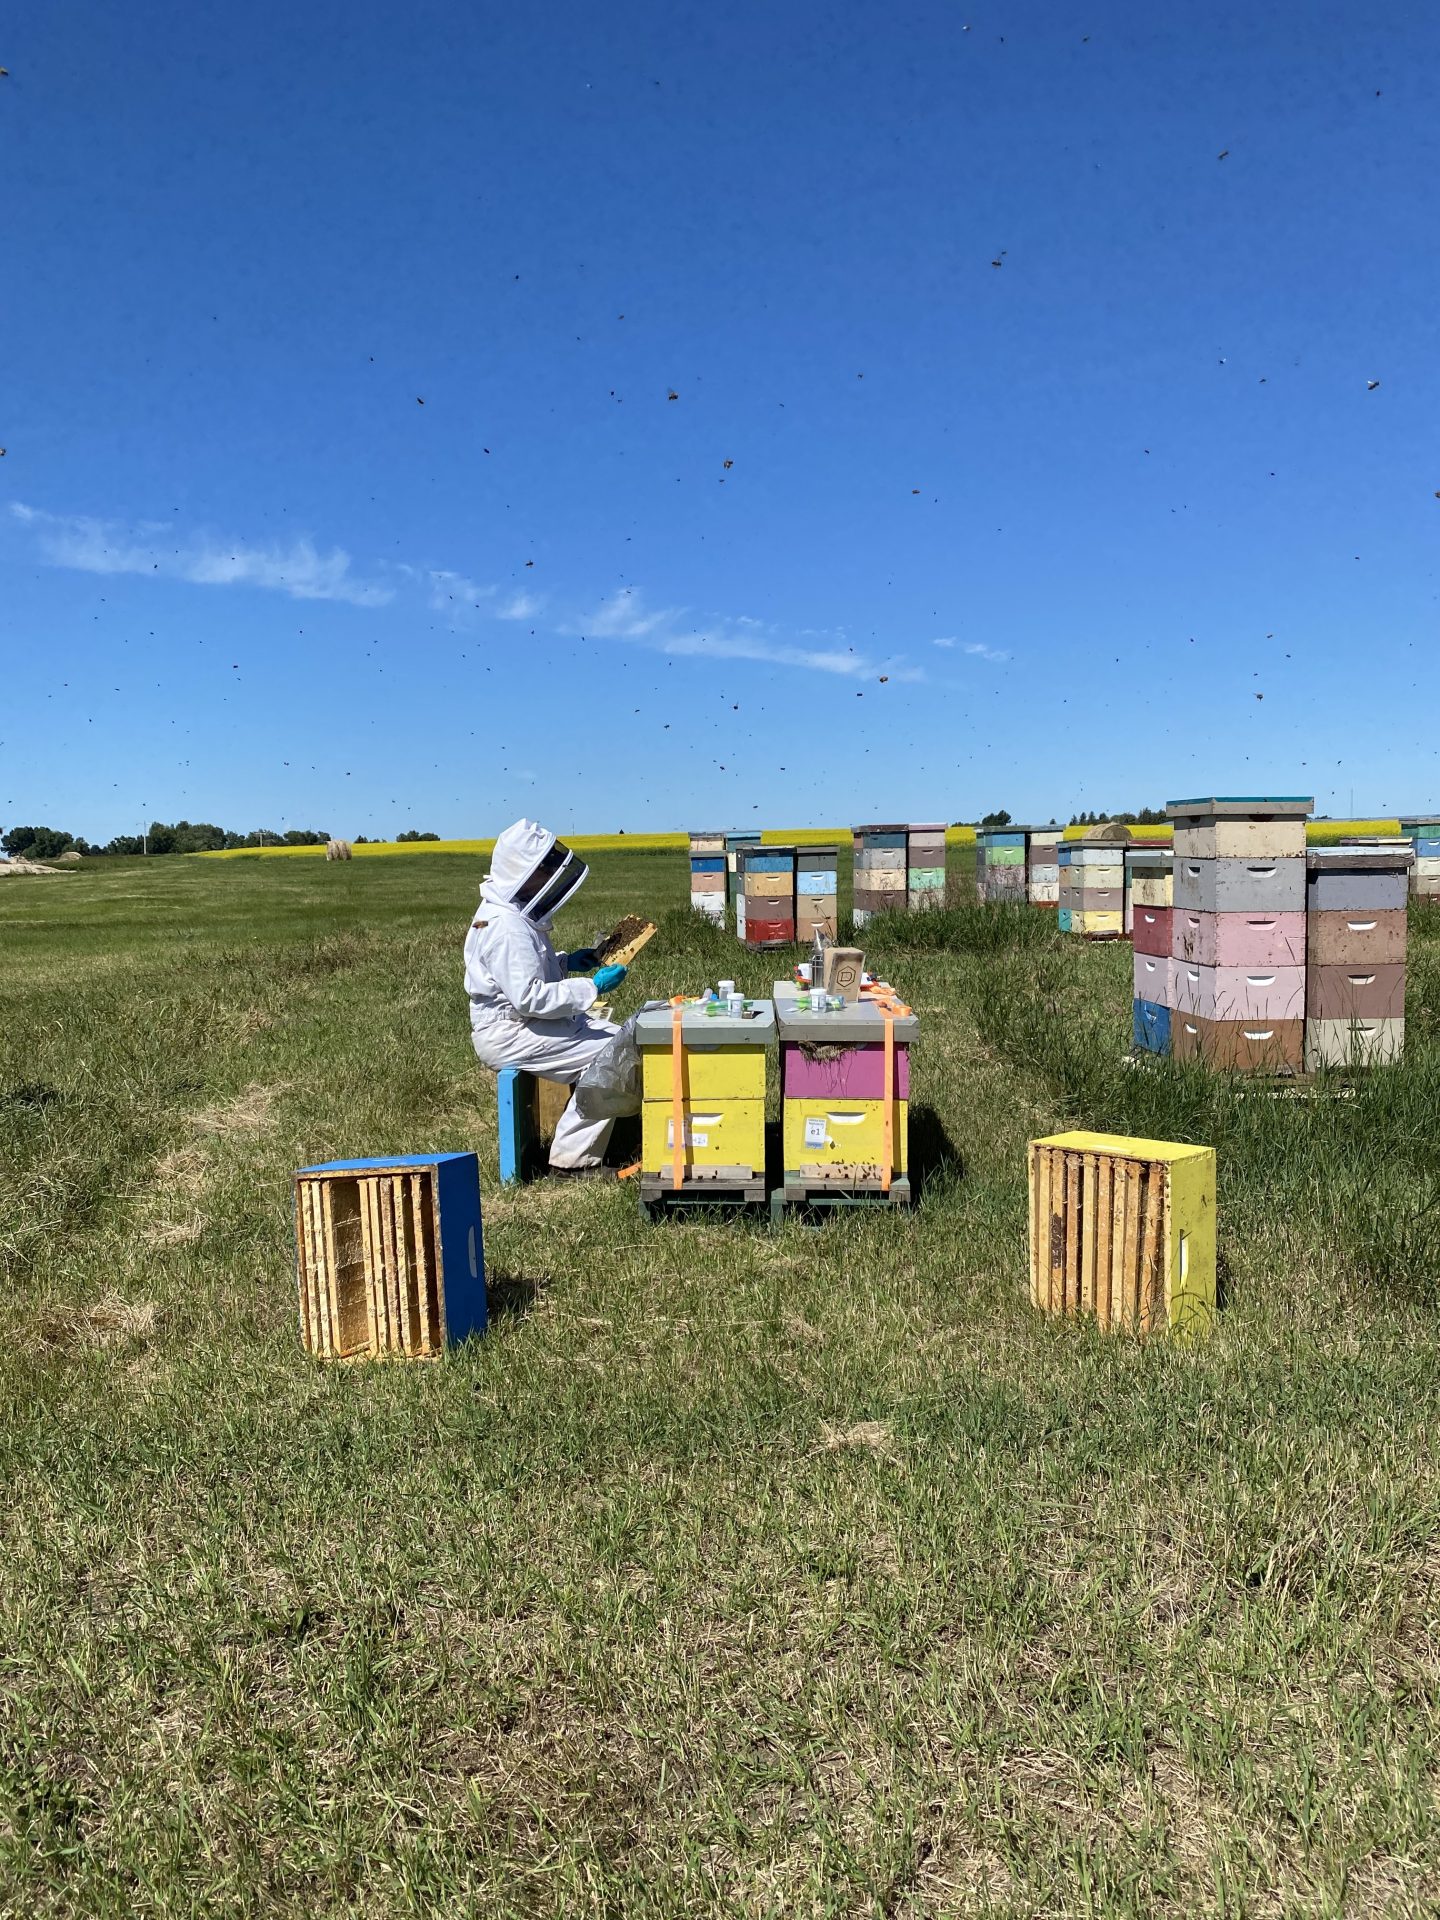
By: Jay Evans, USDA Beltsville Bee Lab
Many self-care routines have an element of putting stresses in context. Is that a big fire? Can you picture a way out? Is it a cougar or housecat (love this video! https://www.youtube.com/watch?v=XuA1PwdOzT4?)? The second goal is identifying which challenges are actionable and which are not. Beekeeping is the same way. A good beekeeper has substantial tools and knowledge to address many of the stresses any one colony will face, and they act where it is appropriate, balancing time, expenses and skill. Knowing when to act depends on assessing the big picture, often with tools of diagnosis like sticky boards and mite washes, less often with nosema counts and brood assays, balanced by a careful visual examination of colony members and resources.
Unfortunately, beekeepers are often unaware of the stresses faced by their bees in the real world. There is a meme going around that honey bees are truly analogous to chickens and cows with respect to their outside habits, but neither of those animals will divide up and travel miles to find dozens of different food types, before returning to a huge home to share their risks and rewards. This is not to pick on livestock, which many of us depend on, nor is it an entry into the debate over whether honey bees are more ‘wild’ (they do depend in large part on human help). But the distinction is important when thinking of stress factors brought into the colony, and especially for stress factors that beekeepers either can’t afford to measure in real time or are not trained to identify and address.
Sarah French and colleagues have just published an immense compilation of stresses faced by honey bees in Canada. Even more ambitiously, they have added weighting factors to those stresses, to help predict which are really worth caring about (French, S.K.; Pepinelli, M.; Conflitti, I.M.; Jamieson, A.; Higo, H.; Common, J.; Walsh, E.M.; Bixby, M.; Guarna, M.M.; Pernal, S.F.; Hoover, S.E.; Currie, R.W.; Giovenazzo, P.; Guzman-Novoa, E.; Borges, D.; Foster, L.J.; Zayed, A. (2024) Honey bee stressor networks are complex and dependent on crop and region. Current Biology, 34, 1893-1903.e1893, doi:https://doi.org/10.1016/j.cub.2024.03.039). This is not the first such effort nor will it be the last. I advertised an excellent synthesis of hive stresses from Nathalie Steinhauer and the Bee Informed Partnership in the March 2021 Bee Culture (“Found in Translation: Dukes of hazard counting”, pages 22-23… it should have been ‘Duchesses’). Their great paper (Steinhauer, N.; Kulhanek, K.; Antúnez, K.; Human, H.; Chantawannakul, P.; Chauzat, M.P.; vanEngelsdorp, D. Drivers of colony losses. Current Opinion in Insect Science 2018, 26, 142-148, doi:10.1016/j.cois.2018.02.004) is one of the best entries into the world of bee stress and stress management. Many of us have worked our little hearts out following leads from papers like that to identify and mitigate the important factors that affect bee health. But the recent work is a gorgeous one and the most complete effort to date to see how the toxic twins or quadruplets of stress have subtle, but ultimately harmful, effects on bee health.
First a caveat, in this paper the researchers do not present data on hive strength, visual pathologies, or survival, though hopefully such data will be folded in down the road. Instead, they cleverly take each independent measurement as a signal for stress in a colony by quantifying its tendency to co-occur with other known bad actors. First, the 54 pesticides, parasites, pathogens and food resources measured are all in the running to be negatives for bee health. Their logic is that higher counts of bad things reflect more colony stress. More subtly, at least some of the stress factors that co-occur with others might be drivers for things going downhill in a colony. For example, a chemical stress that consistently pairs with disease might be a candidate for impairing bee immunity. A few of the metrics have a quantitative basis, e.g., diet ‘risk’, but most data points reflect the presence or absence of a stress factor. As a bonus, the Supplemental Materials do present evidence for pesticide loads for a number of targets, rather than just the presence or absence of a specific pesticide. They followed colonies (240 total) in two distinct two seasons in eight beekeeper- and farmer-relevant crops, split into 60 apiaries of precisely four colonies (this is an enviously organized study).

The big take-aways are:
- Bees in different crops bring back decent numbers and levels of both pesticides and disease, in about equal measure (on average 15 hits total, seven from chemicals and eight from biotics). Since these measurements were taken inside hives, the authors have pretty high confidence that the results transcend ‘hazards’ (“the sky is falling but not just yet”) and truly represent ‘risk’ (“you just ate a bad piece of shellfish”).
- In this study of bees across one or two years, certain crops seem to have lower risks in terms of raw counts than others (yay, Canadian lowbush blueberries, apple, and soybean) while others are quite full of identified risk factors (e.g., cranberry, canola, highbush blueberries). Please do not THINK of making pollination decisions or angry calls based only on these crop differences in raw counts, again colony fates are not presented here so we really don’t know how these risks translate into bee colony health (see early work by May Berenbaum describing how you might do this of, e.g., Does the honey bee “risk cup runneth over?” in the Journal of Agricultural and Food Chemistry (2016), 64, 1, 13–20; https://doi.org/10.1021/acs.jafc.5b01067). Nevertheless, the premise of all this hard work is that less stress is better and lower counts relate to lower stress.
- Stress factors increased from pre-planting through the bloom and often continued to increase after pollination was finished. However, in some crops risk factors were high from the start and stayed evenly high. Bees in cranberry fields showed 30 risk factors on average at the start, with an amazing 400+ co-occurrences within colonies, and those numbers increased only slightly over the pollination period. The authors label co-occurrences as interactions but more tedious studies will be needed to see which measured traits interact at the same time in the same bee, though that is nitpicky and we made the same best-guess in a ‘mini-me’ version of this approach during the throes of Colony Collapse Disorder (Cornman, R.S., Tarpy, D.R., Chen, Y., Jeffreys, L., Lopez, D., Pettis, J.S., vanEngelsdorp, D., and Evans, J.D. Pathogen webs in collapsing honey bee colonies. (2012) PLoS ONE 7,e43562.,https://journals.plos.org/plosone/article?id=10.1371/journal.pone.0043562). In the current huge study, the authors take care to statistically reduce the impacts of seasonality on increases by separating “time between collections” as much as possible from pre-, mid- and post-pollination, a great idea.
- The ranking of different stress sources by importance based on their network size is beautiful and my guess is there are enough chemical and disease predictions in Figure 4 alone to gas up a dozen PhD projects or regulatory tests. Especially when those pairings are connected to colony metrics or match similar rankings from other large-scale field studies. I know a lot of acronyms for disease agents but not for chemicals, so it popped out that the relative web sizes of several viruses increased over time (you have to drag down the supplemental figures or bug the authors for the figure describing the first collection). Also, the web from the first collection point seems to place a lower importance on the web size for ‘mites’, perhaps reflecting the cascading effects of mites as things go downhill and their numbers increase.Can you use this information in managing your bees? I would argue yes, it certainly points to the value of monitoring disease in different settings, and perhaps the snowball effect of bad actors over the season. It is also quite helpful to compare these results with painstaking experiments aimed at individual pairs (i.e., fungicides paired with a pesticide or nosema) that small-scale experiments have explored. Do these pairings of toxic twins present a risk across Canada? Do they present risks in other areas with similar bees and agriculture and numbers of treatable diseases? The icing on this particular cake will come when the authors merge in colony strength and loss data and they are on to that, with updates at https://beecsi.ca/. So save room for dessert!
