


August 2024 Regional Honey Price Report
Reporting Regions |
||||||||||||
|---|---|---|---|---|---|---|---|---|---|---|---|---|
Region 1 |
Region 2 |
Region 3 |
Region 4 |
Region 5 |
Region 6 |
Region 7 |
Summary |
History |
||||
| Extracted Honey Prices Sold Bulk to Packers or Processors |
Range |
Average |
Price/Pound |
Last Month |
Last Year |
|||||||
| 55 Gallon Drum – Light ($/lb) | 2.30 | 2.20 | 2.80 | 3.03 | 3.20 | 3.00 | – | 2.0-3.50 | 2.78 | 2.78 | 2.97 | 2.93 |
| 55 Gallon Drum – Amber ($/lb) | 2.30 | 2.16 | 2.50 | 2.91 | 3.30 | 2.85 | – | 2.00-3.50 | 2.70 | 2.70 | 2.96 | 2.98 |
| 60 Pound Light (Retail) | 246.82 | 300.48 | 264.14 | 216.00 | 211.67 | 207.86 | – | 120.00-450.00 | 248.15 | 4.14 | 248.03 | 249.77 |
| 60 Pound Amber (Retail) | 228.36 | 261.13 | 250.29 | 208.00 | 220.00 | 152.29 | – | 115.58-325.00 | 231.66 | 3.86 | 242.82 | 241.49 |
| Wholesale Prices Sold to Stores or Distributors in Case Lots | ||||||||||||
| 1/2 Pound per Case of 24 | 98.26 | 150.80 | 117.44 | 93.605 | – | 90.00 | – | 72.00-200.00 | 108.06 | 9.01 | 103.03 | 101.57 |
| 1 Pound per Case of 24 | 168.49 | 215.17 | 198.50 | 147.43 | 185.00 | 131.92 | – | 60.80-360.00 | 175.31 | 7.30 | 157.39 | 162.76 |
| 2 Pound per Case of 12 | 136.60 | 201.47 | 215.60 | 132.40 | – | 180.00 | – | 60.90-360.00 | 159.27 | 6.64 | 146.26 | 147.69 |
| 12 Ounces Plastic per Case of 24 | 121.23 | 245.00 | 183.67 | 107.67 | 101.00 | 114.96 | – | 63.00-288.00 | 140.97 | 7.83 | 128.49 | 122.04 |
| 5 Pound per Case of 6 | 169.98 | 400.00 | 344.40 | 138.00 | 150.00 | – | – | 101.95-420.00 | 194.34 | 6.48 | 160.06 | 149.72 |
| Quarts per Case of 12 | 173.25 | 234.75 | 204.17 | 170.80 | 190.00 | 194.94 | 293.94 | 76.00-360.00 | 201.81 | 5.61 | 204.18 | 203.82 |
| Pints per Case of 12 | 102.67 | 151.00 | 153.67 | 110.25 | 152.50 | 135.00 | 146.97 | 72.00-330.00 | 138.60 | 7.70 | 123.39 | 128.68 |
| Retail Shelf Prices | ||||||||||||
| 1/2 Pound | 6.53 | 8.48 | 6.27 | 4.96 | – | 5.83 | 10.00 | 2.00-14.00 | 6.66 | 13.31 | 6.84 | 6.37 |
| 12 Ounces Plastic | 7.63 | 9.92 | 8.37 | 8.45 | 7.16 | 6.95 | – | 4.59-20.00 | 8.37 | 11.16 | 8.75 | 7.72 |
| 1 Pound | 10.54 | 12.40 | 11.49 | 8.84 | 11.00 | 9.25 | 14.75 | 4.59-20.00 | 8.37 | 11.16 | 8.75 | 7.72 |
| 2 Pound | 17.77 | 21.50 | 19.52 | 22.54 | 18.28 | 15.50 | 35.75 | 10.89-60.00 | 20.83 | 10.42 | 18.53 | 17.24 |
| Pint | 12.14 | 15.77 | 12.94 | 12.88 | 18.50 | 17.60 | 19.00 | 7.00-30.00 | 14.39 | 9.59 | 14.49 | 13.12 |
| Quart | 23.43 | 27.46 | 24.37 | 23.13 | 25.25 | 25.50 | 29.00 | 8.00-30.00 | 24.84 | 8.28 | 26.60 | 22.31 |
| 5 Pound | 35.99 | 30.70 | 30.87 | 23.02 | – | 28.66 | – | 12.00-45.00 | 32.31 | 6.46 | 34.74 | 37.25 |
| 1 Pound Cream | 11.85 | 16.74 | 12.25 | 13.25 | 10.99 | 20.00 | – | 12.00-45.00 | 12.66 | 12.66 | 14.71 | 12.46 |
| 1 Pound Cut Comb | 15.61 | 23.00 | 19.80 | 14.00 | 12.00 | 20.00 | – | 12.00-65.00 | 16.47 | 16.47 | 16.52 | 16.11 |
| Ross Round | 10.43 | 20.00 | 17.50 | 11.93 | – | – | – | 6.92-25.00 | 12.45 | 16.60 | 13.52 | 14.55 |
| Wholesale Wax (Light) | 7.75 | 8.13 | 7.13 | 6.71 | 8.00 | 5.50 | – | 7.00-28.00 | 7.40 | – | 7.55 | 7.03 |
| Wholesale Wax (Dark) | 6.59 | 6.96 | 5.44 | 6.05 | 8.00 | 4.00 | – | 3.00-25.00 | 6.39 | – | 6.56 | 6.15 |
| Pollination Fee/Colony | 78.57 | 81.67 | 85.00 | 151.67 | 185.00 | 6.00 | 185.00 | 2.50-200.00 | 97.67 | – | 118.26 | 103.71 |
| Price of Packages | 151.25 | 165.00 | 118.33 | 155.00 | – | – | – | 105.00-180.00 | 144.50 | – | 158.91 | 156.03 |
Please note: anywhere within each region that there is a ‘-‘ it is because no information was sent to us for that specific item in that region.
How do you compare to our honey reporters? All data collected is from May/June 2024.
Average Honey Flow Time and Amount per Region
Region 1:
Timing of Flow: Early
Amount of Flow: Average
Region 2:
Timing of Flow: Normal
Amount of Flow: Average
Region 3:
Timing of Flow: Normal
Amount of Flow: Average
Region 4:
Timing of Flow: Early
Amount of Flow: Average
Region 5:
Timing of Flow: Equally Normal and Late
Amount of Flow: Equally Light and Average
Region 6:
Timing of Flow: Normal
Amount of Flow: Average
Region 7:
Timing of Flow: Normal
Amount of Flow: Average
Top Blossoming Plants per Region
Region 1: Clover, Honeysuckle, Dandelion, Black Locust, Apple, Locust, White Clover, Tulip Poplar, Autumn Olive
Region 2: Blackberry, Clover, Tulip Poplar, White Clover, Black Locust, Poplar, Privet
Region 3: Clover, Privet, Magnolia, Wildflowers, Tallow, Sumac, Chinese Tallow
Region 4: Black Locust, Autumn Olive, Clover, Dandelion, Honeysuckle, Apple, Dutch Clover, White Clover, Yellow Sweet Clover
Region 5: Dandelion, Clover, Alfalfa
Region 6: Clover, Milkweed, Privet, Vitex, Coreopsis, Gaillardia
Region 7: Maple, Blackberry
Overall Top Blossoming Plants
Clover, Black Locust, Blackberry, Honeysuckle, White Clover, Privet, Tulip Poplar, Dandelion, Apple
Mite Treatment per Region
Region 1: Most used no mite treatment.
Region 2: Most used no mite treatment.
Region 3: Most used no mite treatment.
Region 4: Most used no mite treatment.
Region 5: Most used a non-chemical mite treatment.
Region 6: Mist used an Oxalic Acid Vapor product.
Region 7: Most used no mite treatment or a non-chemical mite treatment.
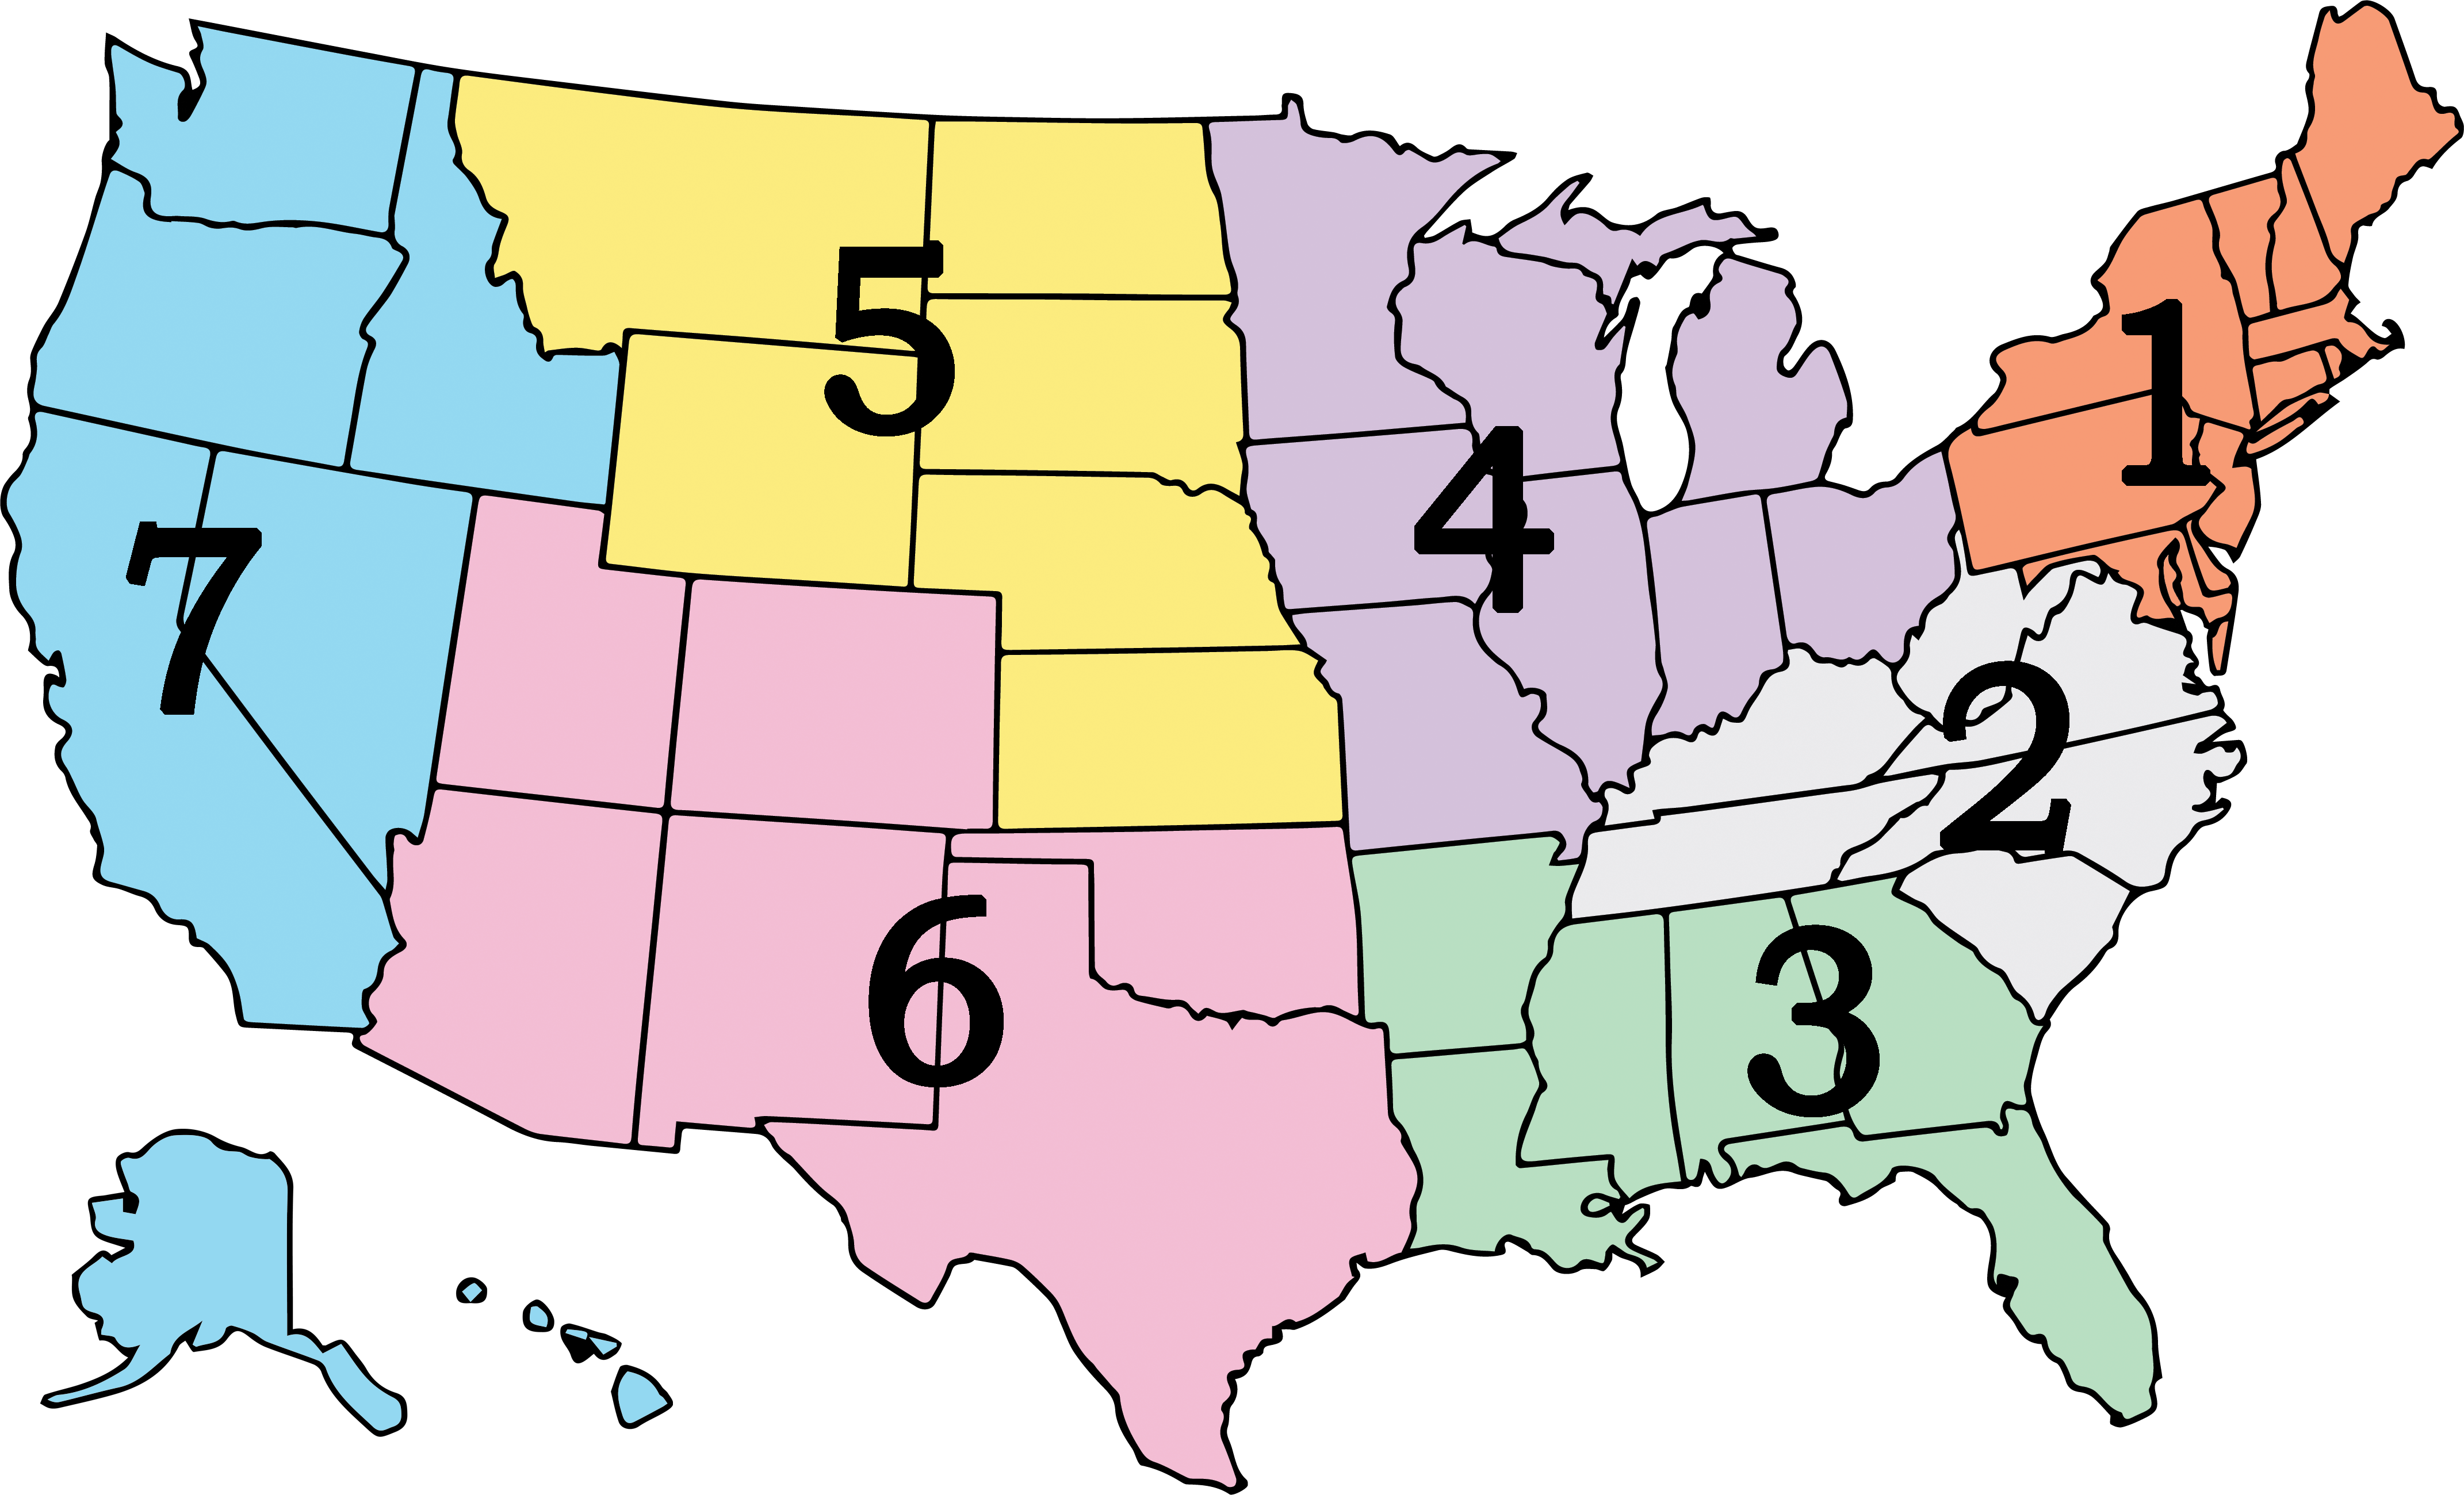 To the left is the map of our regions. All responses are collected from individuals within each region. If you are interested in becoming a report for Bee Culture, please fill out this form: https://forms.gle/qai8NFY2th3a4c696
All reporters who are returning forms will receive a free subscription to Bee Culture! Questions? Email Stephanie@BeeCulture.com