


June 2024 Regional Honey Price Report
Reporting Regions |
||||||||||||
|---|---|---|---|---|---|---|---|---|---|---|---|---|
Region 1 |
Region 2 |
Region 3 |
Region 4 |
Region 5 |
Region 6 |
Region 7 |
Summary |
History |
||||
| Extracted Honey Prices Sold Bulk to Packers or Processors |
Range |
Average |
Price/Pound |
Last Month |
Last Year |
|||||||
| 55 Gallon Drum – Light ($/lb) | 2.15 | – | 3.32 | 2.70 | 2.99 | 2.35 | 3.50 | 1.70-4.00 | 2.86 | 2.86 | 2.95 | 2.88 |
| 55 Gallon Drum – Amber ($/lb) | 2.38 | 3.55 | 3.32 | 2.66 | 3.20 | 2.23 | 2.88 | 1.50-3.60 | 2.81 | 2.81 | 2.83 | 2.76 |
| 60 Pound Light (Retail) | 242.24 | 283.20 | 261.00 | 216.88 | 233.75 | 222.67 | 310.00 | 120.00-390.00 | 245.39 | 4.09 | 255.52 | 230.62 |
| 60 Pound Amber (Retail) | 236.18 | 271.00 | 257.00 | 222.33 | 250.00 | 230.25 | 248.33 | 120.00-340.00 | 241.59 | 4.03 | 245.07 | 227.21 |
| Wholesale Prices Sold to Stores or Distributors in Case Lots | ||||||||||||
| 1/2 Pound per Case of 24 | 98.91 | 131.00 | 98.40 | 92.50 | 87.36 | 90.00 | – | 46.00-192.00 | 100.88 | 8.41 | 102.15 | 104.95 |
| 1 Pound per Case of 24 | 175.45 | 177.63 | 183.87 | 141.32 | 180.95 | 134.94 | 144.00 | 83.00-360.00 | 167.25 | 6.97 | 165.75 | 157.21 |
| 2 Pound per Case of 12 | 151.08 | 201.50 | 146.50 | 128.73 | 173.76 | 156.00 | 156.00 | 60.90-360.00 | 152.10 | 6.34 | 161.44 | 143.53 |
| 12 Ounces Plastic per Case of 24 | 139.73 | 170.77 | 143.19 | 107.49 | 118.88 | 113.88 | 120.00 | 47.40-288.00 | 134.99 | 7.50 | 134.98 | 117.74 |
| 5 Pound per Case of 6 | 171.66 | 236.80 | 239.46 | 131.34 | 156.48 | 96.00 | – | 96.00-360.00 | 171.61 | 5.72 | 170.63 | 160.17 |
| Quarts per Case of 12 | 194.67 | 223.20 | 213.95 | 174.32 | 191.05 | 197.94 | 276.00 | 120.00-336.00 | 205.78 | 5.72 | 195.41 | 183.86 |
| Pints per Case of 12 | 125.80 | 139.17 | 112.0 | 104.71 | 158.50 | 135.00 | 1216.00 | 60.00-288.00 | 131.57 | 7.31 | 121.76 | 118.97 |
| Retail Shelf Prices | ||||||||||||
| 1/2 Pound | 6.61 | 7.44 | 6.11 | 5.42 | 5.45 | 6.75 | 10.00 | 3.50-11.00 | 6.57 | 13.14 | 6.35 | 6.27 |
| 12 Ounces Plastic | 8.34 | 9.02 | 8.09 | 6.70 | 6.55 | 8.47 | 7.00 | 4.59-14.00 | 8.09 | 10.79 | 7.55 | 7.38 |
| 1 Pound | 10.80 | 12.20 | 11.71 | 8.99 | 10.35 | 10.64 | 13.25 | 6.00-20.00 | 10.97 | 10.97 | 10.43 | 9.98 |
| 2 Pound | 17.95 | 21.32 | 19.71 | 15.90 | 21.55 | 15.32 | 22.33 | 7.29-30.00 | 18.53 | 9.26 | 17.77 | 16.78 |
| Pint | 12.23 | 15.23 | 12.29 | 12.80 | 16.10 | 17.50 | 17.75 | 7.00-30.00 | 13.99 | 9.33 | 13.35 | 12.31 |
| Quart | 24.21 | 25.57 | 22.04 | 21.09 | 21.29 | 25.59 | 25.13 | 11.20-42.00 | 23.62 | 7.87 | 22.41 | 21.69 |
| 5 Pound | 41.17 | 44.14 | 46.12 | 29.79 | 38.85 | 32.38 | – | 16.00-70.00 | 39.27 | 7.85 | 37.79 | 36.68 |
| 1 Pound Cream | 12.76 | 14.21 | 13.67 | 11.20 | 12.00 | 14.33 | 14.00 | 6.79-21.00 | 12.87 | 12.87 | 11.40 | 11.62 |
| 1 Pound Cut Comb | 16.58 | 21.04 | 16.43 | 15.80 | – | 20.00 | – | 8.00-32.00 | 16.89 | 16.89 | 15.19 | 14.04 |
| Ross Round | 13.42 | 17.66 | 18.00 | 12.00 | 15.00 | – | 16.00 | 8.00-24.00 | 14.85 | 19.80 | 12.55 | 14.09 |
| Wholesale Wax (Light) | 7.57 | 7.92 | 8.20 | 7.41 | 8.00 | 6.50 | 6.13 | 3.00-10.00 | 7.54 | – | 7.15 | 8.62 |
| Wholesale Wax (Dark) | 5.96 | 6.92 | 7.60 | 6.10 | – | 7.00 | 8.00 | 2.50-10.00 | 6.58 | – | 6.34 | 7.01 |
| Pollination Fee/Colony | 97.73 | 73.00 | 96.25 | 120.00 | – | – | 89.25 | 35.00-200.00 | 95.93 | – | 110.77 | 100.94 |
| Price of Packages | 166.50 | 146.00 | 130.00 | 143.00 | 140.00 | 190.00 | – | 70.00-200.00 | 153.31 | – | 156.33 | – |
Please note: anywhere within each region that there is a ‘-‘ it is because no information was sent to us for that specific item in that region.
How do you compare to our honey reporters? All data collected is from March/April 2024.
Average Honey Flow Time and Amount per Region
Region 1:
Timing of Flow: None
Amount of Flow: None
Region 2:
Timing of Flow: Normal
Amount of Flow: Average
Region 3:
Timing of Flow: Early
Amount of Flow: Average
Region 4:
Timing of Flow: Early
Amount of Flow: None
Region 5:
Timing of Flow: None
Amount of Flow: None
Region 6:
Timing of Flow: Normal
Amount of Flow: Average
Region 7:
Timing of Flow: Normal
Amount of Flow: Average
Top Blossoming Plants per Region
Region 1: Maple, Dandelion, Crocus, Daffodil, Willow, Apple, Henbit, Red Maple
Region 2: Dandelion, Redbud, Apple, Cherry, Maple, Pear, Henbit, Tulip poplar
Region 3: Clover, Blackberry, Dogwood, Honeysuckle, Privet, Tulip Poplar
Region 4: Dandelion, Maple, Henbit, Fruit Trees, Pear, Apple, Autumn, Olive, Dogwood, Willow
Region 5: Dandelion
Region 6: Dandelion, Wildflowers
Region 7: Dandelion, Maple, Cherry, Cottonwood, Plum
Overall Top Blossoming Plants
Dandelion, Maple, Henbit, Apple, Chery, Clover, Redbud, Dogwood, Crocus, pear
Mite Treatment per Region
Region 1: Most used no mite treatment.
Region 2: Most used no mite treatment.
Region 3: Most used no mite treatment.
Region 4: Most used no mite treatment.
Region 5: Most used an unspecified Oxalic Acid product or a Formic product.
Region 6: Most used a Formic product.
Region 7: Most used no mite treatment.
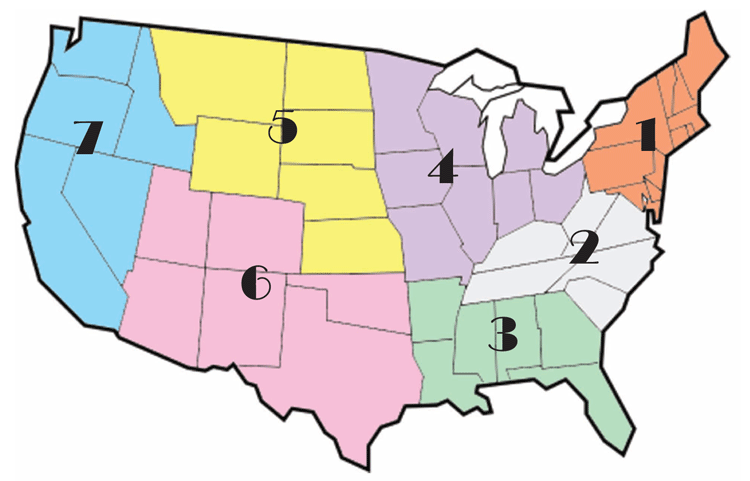 To the left is the map of our regions. All responses are collected from individuals within each region. If you are interested in becoming a report for Bee Culture, please fill out this form: https://forms.gle/qai8NFY2th3a4c696
All reporters who are returning forms will receive a free subscription to Bee Culture! Questions? Email Emma@BeeCulture.com