


Ross Conrad
The chart and table below were inadvertently left out of Ross Conrad’s article in our September issue. We apologize to Ross and to our readers for any confusion this may have caused.
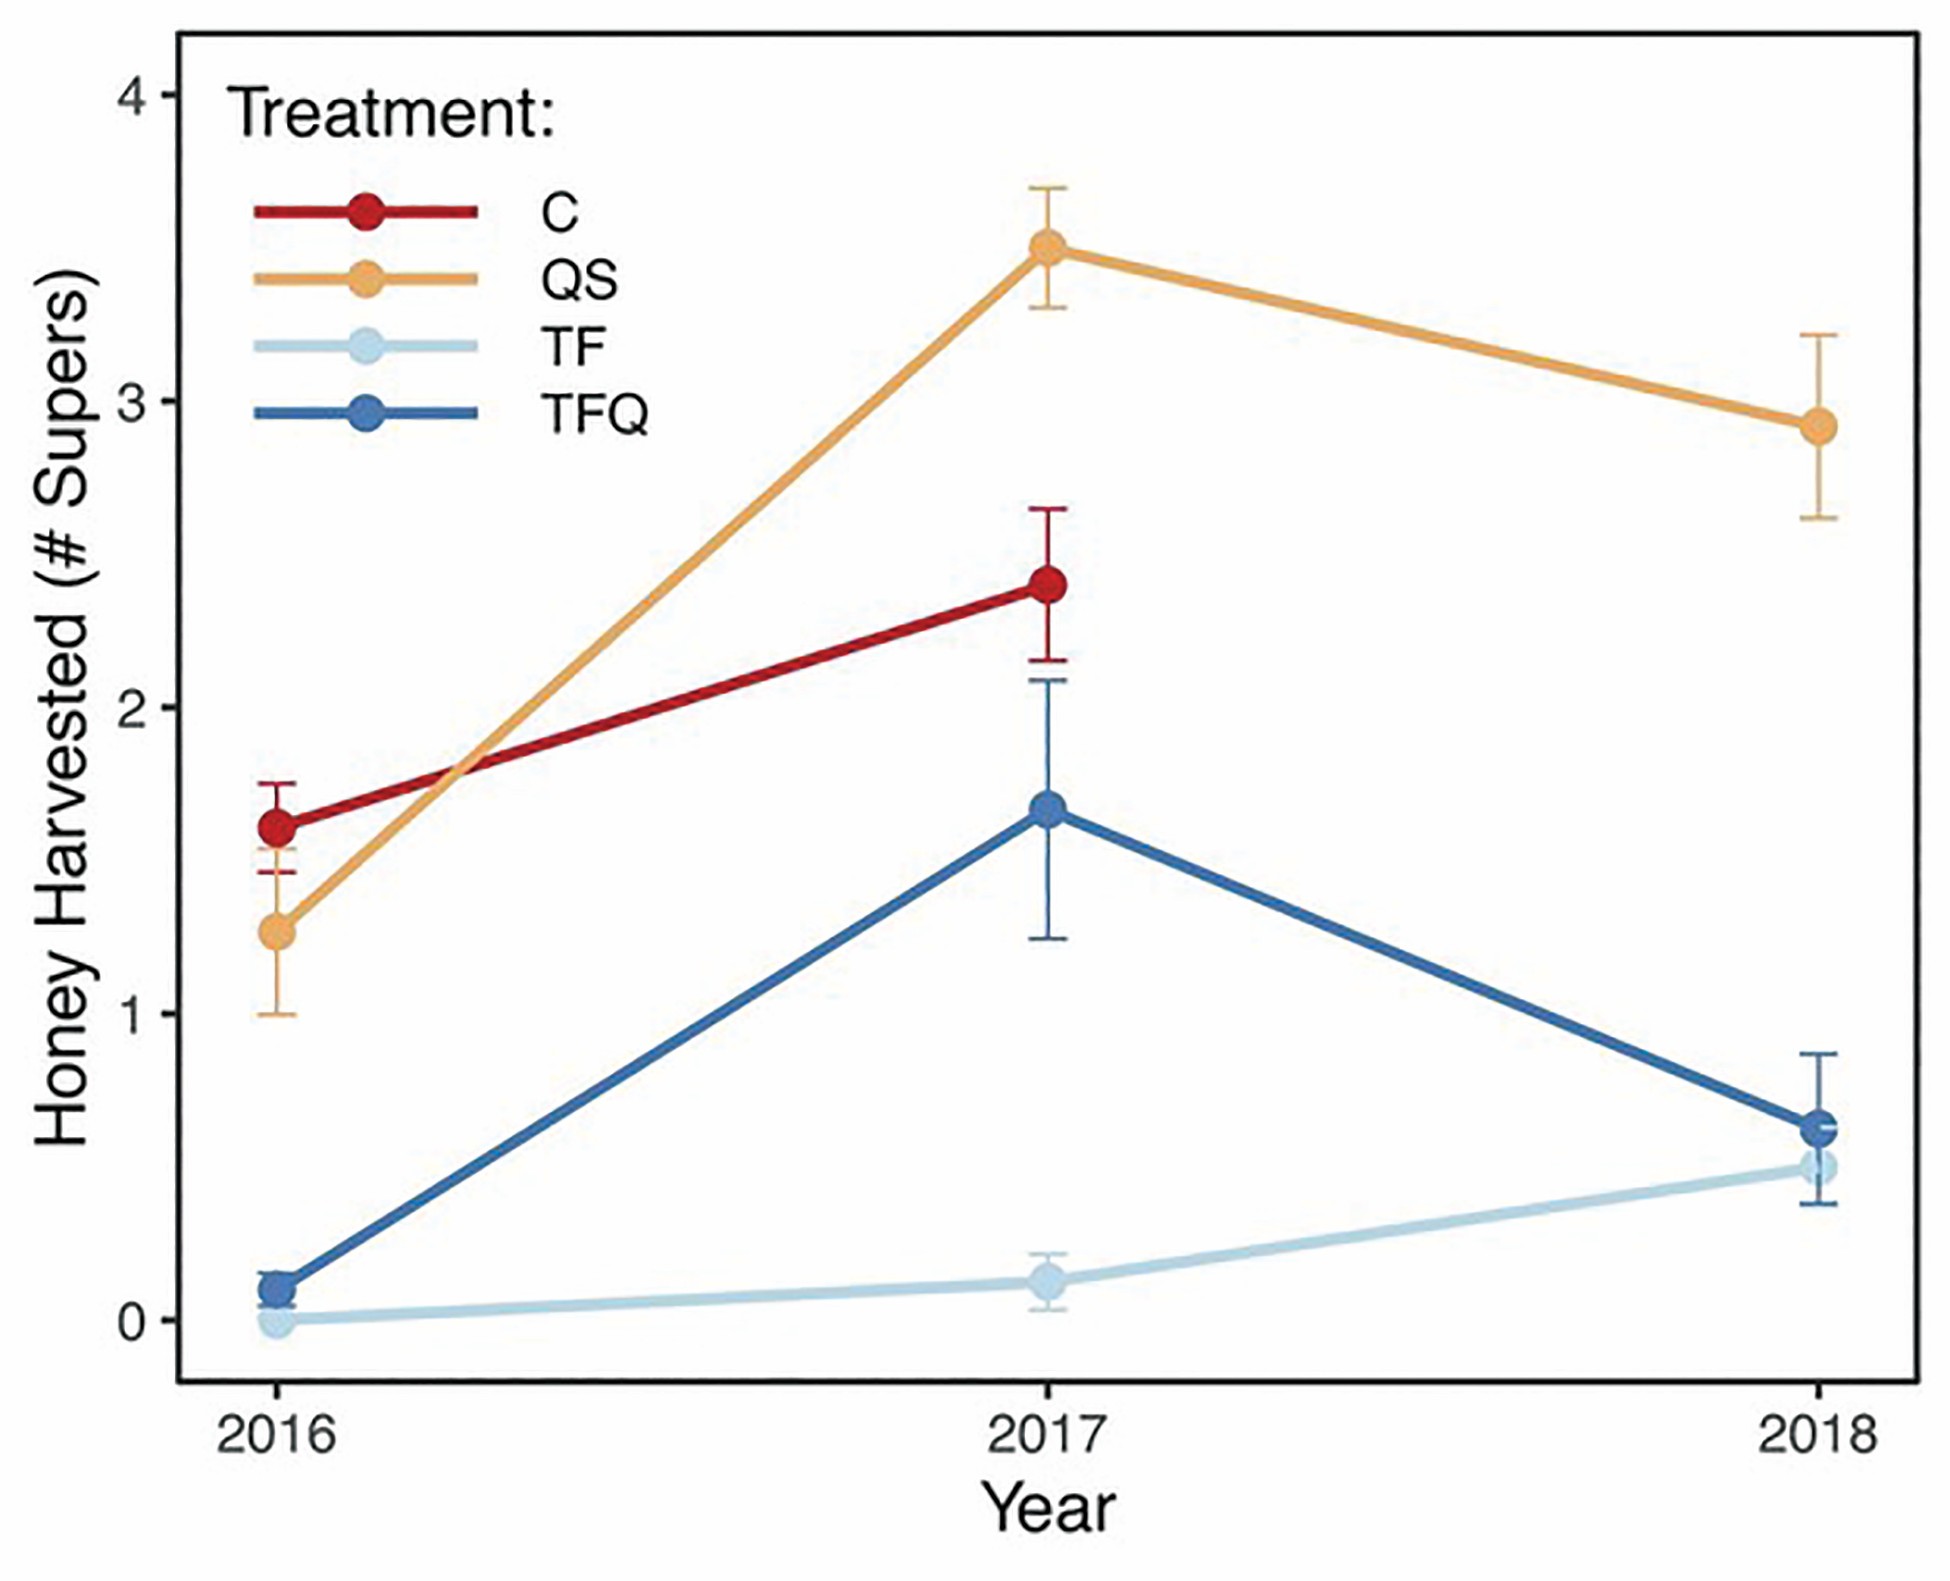
Honey harvested for each year of the study in number of supers across the four treatments. Red lines represent the control, orange lines represent quick strips, light blue lines represent treatment free with requeening and dark blue lines represent the treatment-free group without requeening. All error bars represent one standard error.
| Table 1. Colony Survival | |||||||||||||||||||||||||||||||||||||||||||||||||||||||||||||||||||||||||||||||||||||
|---|---|---|---|---|---|---|---|---|---|---|---|---|---|---|---|---|---|---|---|---|---|---|---|---|---|---|---|---|---|---|---|---|---|---|---|---|---|---|---|---|---|---|---|---|---|---|---|---|---|---|---|---|---|---|---|---|---|---|---|---|---|---|---|---|---|---|---|---|---|---|---|---|---|---|---|---|---|---|---|---|---|---|---|---|---|
| Group | May 2016 | October 2016 | April 2017 | October 2017 | April 2018 | October 2018 | April 2019 | ||||||||||||||||||||||||||||||||||||||||||||||||||||||||||||||||||||||||||||||
| Control (C) | 15 | 14 | 6 | 5 | 0 | — | — | ||||||||||||||||||||||||||||||||||||||||||||||||||||||||||||||||||||||||||||||
| Quick Strip (QS) | 15 | 14 | 14 | 7 | 7 | 6 | 1 | ||||||||||||||||||||||||||||||||||||||||||||||||||||||||||||||||||||||||||||||
| Treatment-Free (TF) | 15 | 10 | 9 | 8 | 8 | 7 | 1 | ||||||||||||||||||||||||||||||||||||||||||||||||||||||||||||||||||||||||||||||
| Treatment-Free w/Queen (TFQ) | 15 | 15 | 7 | 6 | 4 | 4 | 2 | ||||||||||||||||||||||||||||||||||||||||||||||||||||||||||||||||||||||||||||||