


November 2025 Regional Honey Price Report
Reporting Regions |
||||||||||||
|---|---|---|---|---|---|---|---|---|---|---|---|---|
Region 1 |
Region 2 |
Region 3 |
Region 4 |
Region 5 |
Region 6 |
Region 7 |
Summary |
History |
||||
| Extracted Honey Prices Sold Bulk to Packers or Processors |
Range |
Average |
Price/Pound |
Last Month |
Last Year |
|||||||
| 55 Gallon Drum – Light ($/lb) | – | 3.00 | 2.78 | 2.64 | 2.89 | 3.00 | 3.15 | 1.43-3.60 | 2.84 | 2.84 | 2.97 | 2.64 |
| 55 Gallon Drum – Amber ($/lb) | – | 2.97 | 2.53 | 2.74 | 3.20 | 2.85 | 3.00 | 1.43-3.60 | 2.77 | 2.77 | 2.99 | 2.72 |
| 60 Pound Light (Retail) | 269.58 | 283.75 | 249.86 | 233.43 | 242.50 | 249.50 | 177.25 | 4.50-360.00 | 252.01 | 4.20 | 256.64 | 248.70 |
| 60 Pound Amber (Retail) | 273.89 | 251.25 | 235.57 | 229.57 | 229.80 | 260.00 | 346.33 | 160.00-550.00 | 259.44 | 4.32 | 261.77 | 241.69 |
| Wholesale Prices Sold to Stores or Distributors in Case Lots | ||||||||||||
| 1/2 Pound per Case of 24 | 134.23 | 126.20 | 103.20 | 119.50 | 87.36 | 108.00 | – | 84.00-240.00 | 122.72 | 10.23 | 111.26 | 107.57 |
| 1 Pound per Case of 24 | 192.36 | 272.63 | 179.80 | 181.22 | 181.42 | 167.88 | 254.00 | 100.00-408.00 | 200.78 | 8.37 | 179.20 | 164.99 |
| 2 Pound per Case of 12 | 166.42 | 235.88 | 162.14 | 131.09 | 173.76 | 216.00 | 240.00 | 4.00-350.00 | 172.44 | 7.18 | 159.75 | 154.62 |
| 12 Ounces Plastic per Case of 24 | 146.40 | 186.10 | 194.00 | 144.18 | 121.21 | 138.48 | 132.00 | 78.00-400.00 | 157.91 | 8.77 | 137.81 | 131.92 |
| 5 Pound per Case of 6 | 183.70 | 219.75 | 178.98 | 191.25 | 156.48 | 270.00 | – | 108.00-480.00 | 193.46 | 6.45 | 179.48 | 164.59 |
| Quarts per Case of 12 | 162.81 | 223.00 | 214.67 | 238.91 | 207.37 | 235.67 | 276.00 | 15.25-552.00 | 213.09 | 6.09 | 217.61 | 196.51 |
| Pints per Case of 12 | 108.00 | 163.80 | 107.33 | 134.80 | 124.50 | 123.50 | 166.50 | 72.00-288.00 | 135.14 | 7.51 | 135.60 | 125.56 |
| Retail Shelf Prices | ||||||||||||
| 1/2 Pound | 7.05 | 8.00 | 6.28 | 6.75 | 5.45 | 6.32 | – | 3.29-15.00 | 6.90 | 13.80 | 6.84 | 6.78 |
| 12 Ounces Plastic | 9.46 | 8.98 | 9.79 | 8.38 | 6.53 | 9.67 | 9.50 | 3.79-20.00 | 9.01 | 12.02 | 8.66 | 8.87 |
| 1 Pound | 11.56 | 13.36 | 12.08 | 9.93 | 10.35 | 12.80 | 13.00 | 5.97-25.00 | 11.83 | 11.83 | 11.58 | 11.35 |
| 2 Pound | 20.18 | 23.90 | 21.25 | 17.54 | 21.55 | 23.75 | 21.40 | 10.89-40.00 | 21.15 | 10.58 | 20.22 | 20.22 |
| Pint | 12.00 | 19.57 | 13.77 | 14.07 | 12.24 | 18.50 | 14.75 | 8.00-50.00 | 15.28 | 10.189 | 14.94 | 13.83 |
| Quart | 24.00 | 29.57 | 26.48 | 23.45 | 21.76 | 30.33 | 24.00 | 11.20-45.00 | 25.73 | 8.58 | 26.05 | 24.43 |
| 5 Pound | 61.22 | 42.60 | 38.82 | 37.74 | 34.00 | 39.50 | 28.00 | 17.97-400.00 | 48.56 | 9.71 | 38.71 | 35.97 |
| 1 Pound Cream | 14.91 | 17.67 | 13.79 | 12.71 | 14.00 | 20.00 | 14.00 | 8.00-20.00 | 14.53 | 14.53 | 13.83 | 13.53 |
| 1 Pound Cut Comb | 16.85 | 21.00 | 17.00 | 16.25 | 20.00 | 15.00 | – | 8.00-25.00 | 17.27 | 17.27 | 17.67 | 17.64 |
| Ross Round | 14.00 | 15.00 | – | 14.00 | 16.00 | 25.00 | 16.00 | 10.00-25.00 | 15.78 | 21.04 | 15.27 | 14.38 |
| Wholesale Wax (Light) | 14.00 | 7.50 | 8.25 | 8.43 | 6.66 | 4.00 | 6.25 | 4.00-10.00 | 7.71 | – | 7.75 | 7.59 |
| Wholesale Wax (Dark) | 7.25 | 7.50 | 6.56 | 8.00 | 6.00 | 2.25 | – | 1.50-10.00 | 6.73 | – | 6.75 | 6.69 |
| Pollination Fee/Colony | 80.00 | 80.80 | 84.42 | 168.33 | – | 200.00 | 57.33 | 6.50-225.00 | 95.80 | – | 104.33 | 110.19 |
| Price of Nucs | 152.50 | 198.22 | 197.00 | 188.75 | 172.50 | 230.00 | 206.67 | 40.00-250.00 | 187.80 | – | 193.84 | 200.29 |
| Price of Packages | 145.00 | 161.00 | 172.50 | 140.00 | 165.00 | 150.00 | – | 120.00-250.00 | 161.15 | – | 149.06 | 160.45 |
Please note: anywhere within each region that there is a ‘-‘ it is because no information was sent to us for that specific item in that region.
How do you compare to our honey reporters? All data collected is from August/September 2025.
Average Honey Flow Time and Amount per Region
Region 1:
Timing of Flow: Normal
Amount of Flow: Average
Region 2:
Timing of Flow: Normal
Amount of Flow: Light
Region 3:
Timing of Flow: Normal
Amount of Flow: Average
Region 4:
Timing of Flow: Normal
Amount of Flow: Light
Region 5:
Timing of Flow: Late
Amount of Flow: Light
Region 6:
Timing of Flow: Normal
Amount of Flow: Average
Region 7:
Timing of Flow: Normal
Amount of Flow: Average
Top Blossoming Plants per Region
Region 1: Goldenrod, Aster, Knotweed, Crepe Myrtle, Ragweed
Region 2: Goldenrod, Aster, Wingstem, Ironweed, Clover
Region 3: Goldenrod, Aster, Sunhemp, Smartweed, Wildflower
Region 4: Goldenrod, Aster, Smartweed, Ragweed, Wildflower
Region 5: Goldenrod, Sunflower, Aster, Smartweed
Region 6: Russian Sage, Crepe Myrtle
Region 7: Not enough data was provided to conclusively decide what the top blossoming plants were in this region.
Overall Top Blossoming Plants
Goldenrod, Aster, Knotweed, Smartweed, Sunflower, Crepe Myrtle, Clover, Wingstem, Ragweed
Mite Treatment per Region
Region 1: Most used a Formic product.
Region 2: Most used a Formic product.
Region 3: Most used no mite treatment.
Region 4: Most used either a Formic product or no mite treatment.
Region 5: Most used a Formic product.
Region 6: Most used an Unspecified Oxalic Acid product.
Region 7: Most used another type of mite treatment.
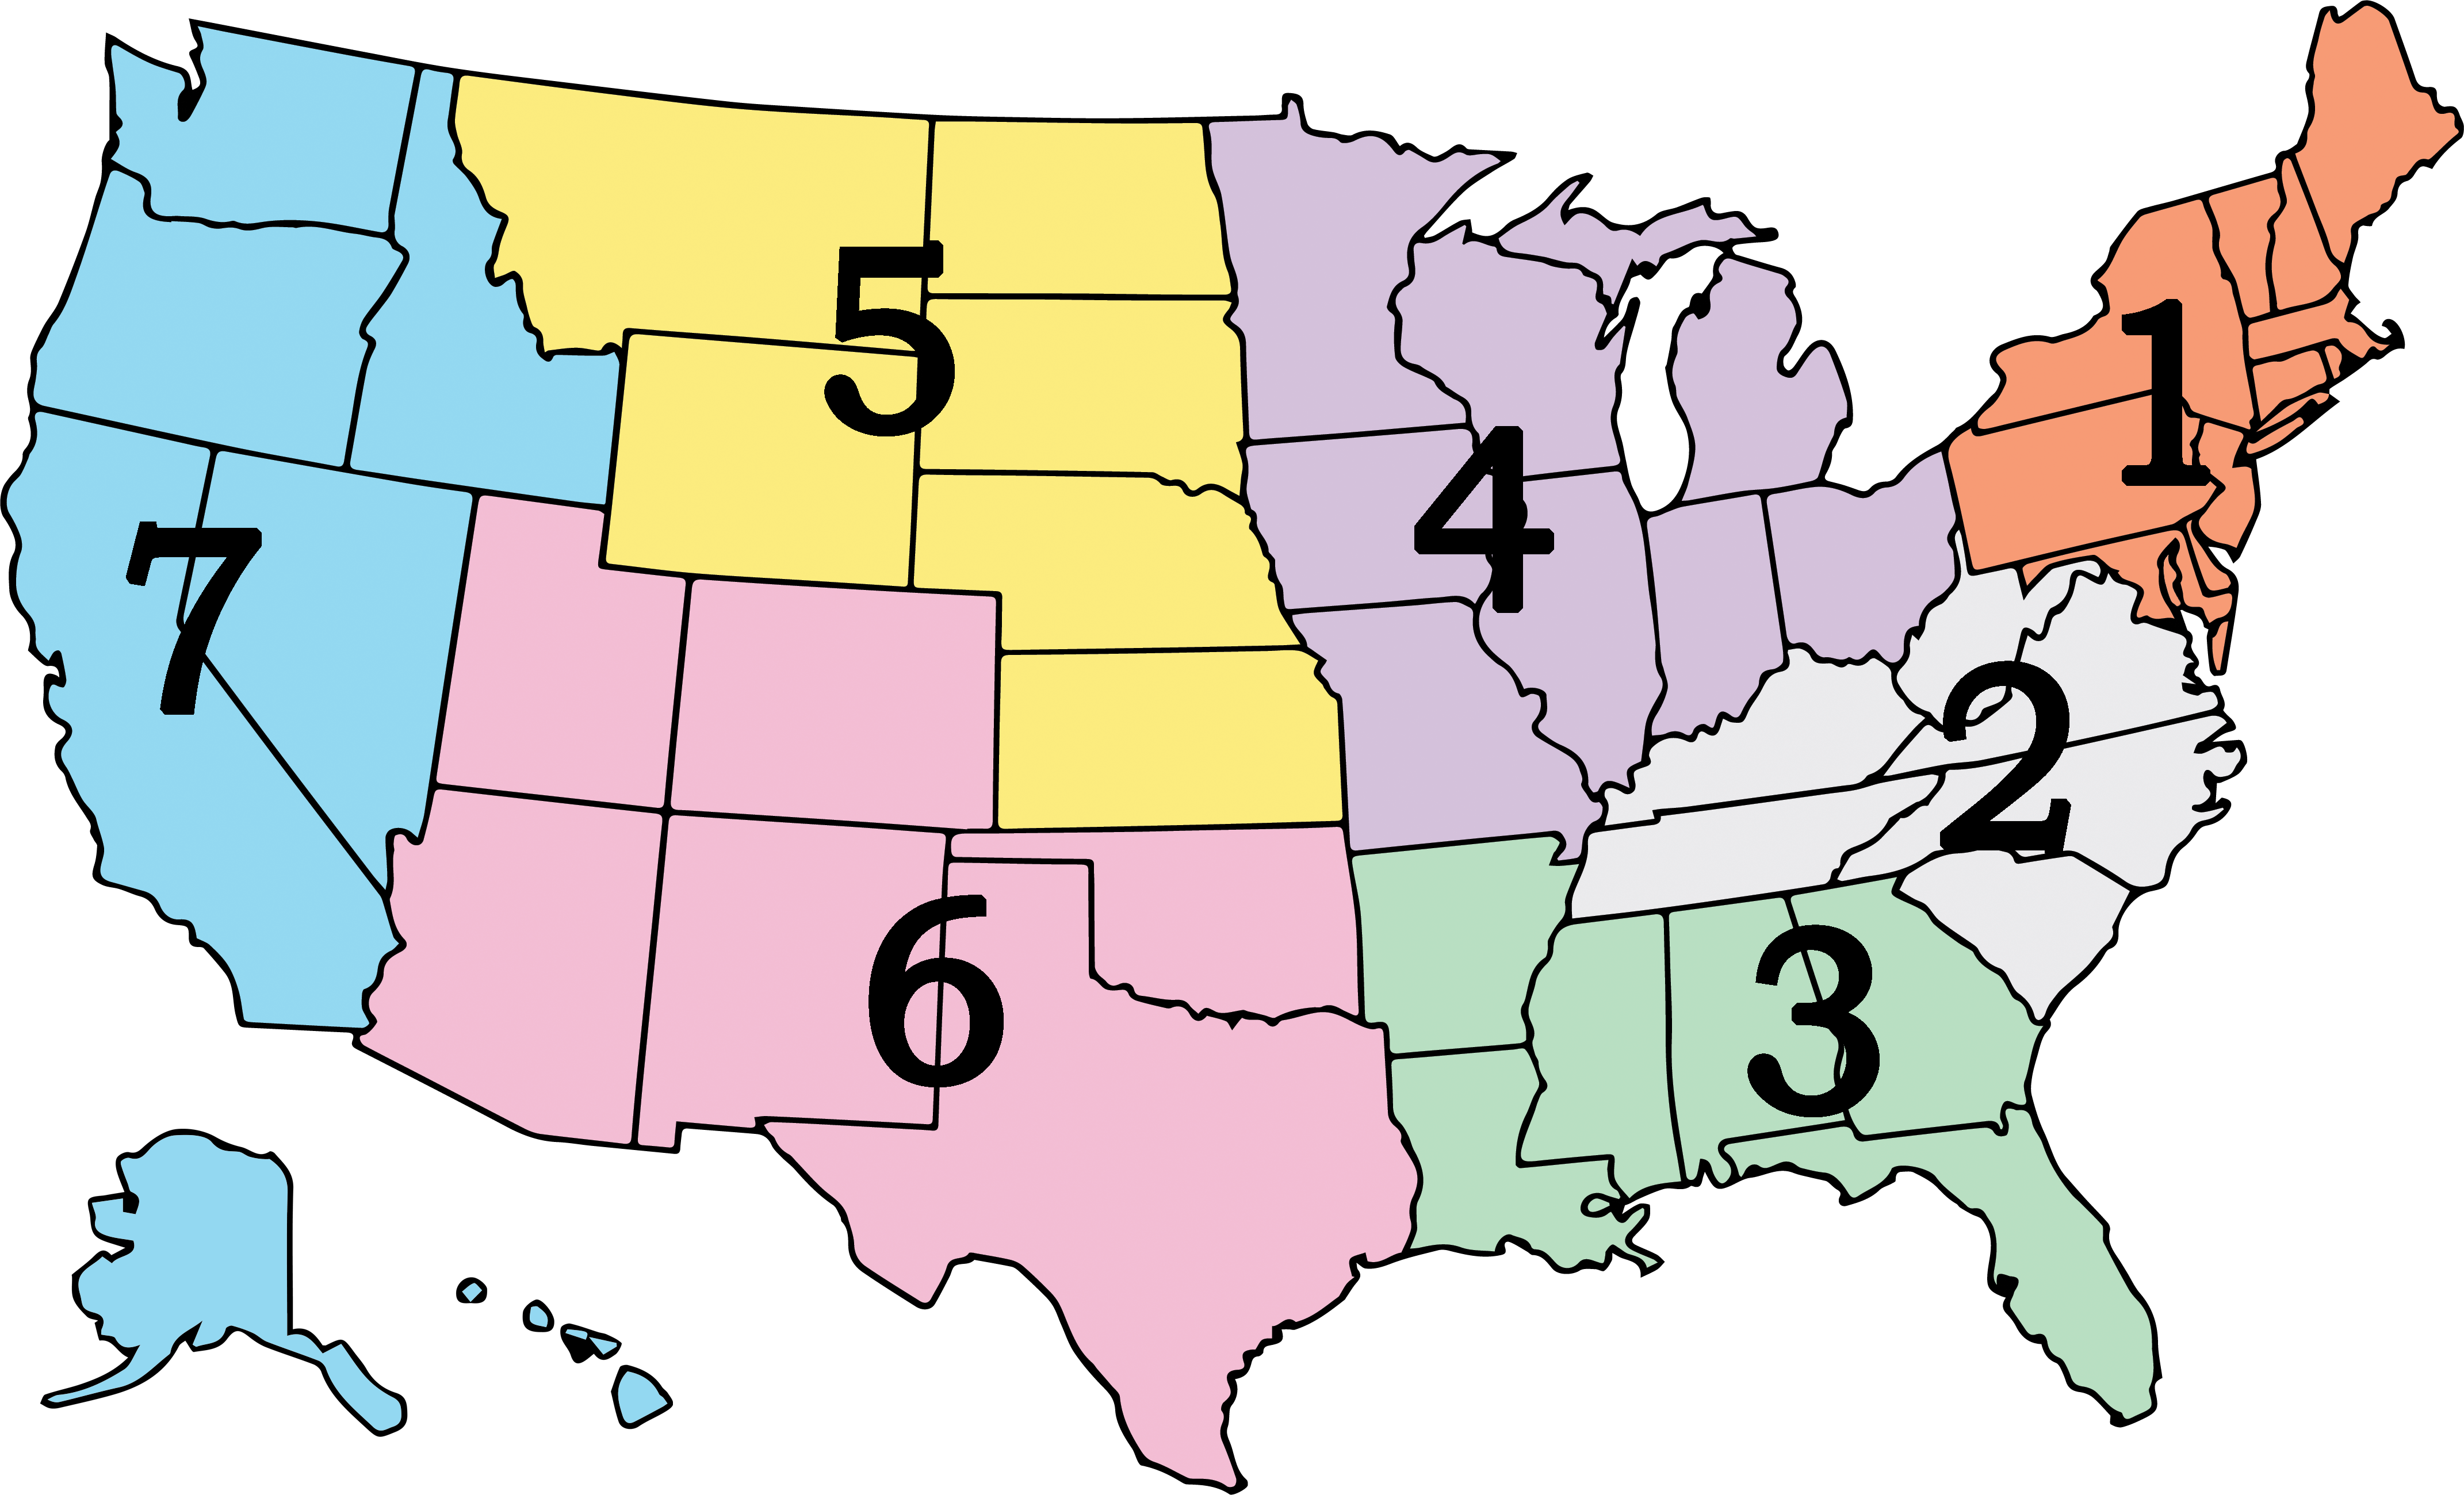 To the left is the map of our regions. All responses are collected from individuals within each region. If you are interested in becoming a reporter for Bee Culture, please fill out this form: https://forms.gle/qai8NFY2th3a4c696
All reporters who are returning forms will receive a free subscription to Bee Culture! Questions? Email Stephanie@BeeCulture.com