


Jay Evans, Author
Climate Effects on Bee Disease
Jay Evans, USDA Beltsville Bee Lab
Western honey bees can thank humans for their current range and abundance to an extent that is rare in the insect world. They join human body lice, crop pests, and several household insects as species that are strongly wedded to our habits. Fortunately, in the case of honey bees this marriage has been good for both partners. One way that humans affect honey bee health is through the climate experienced by colonies. Historically, honey bees dealt with the climate they were born in or swarmed into. They could regulate their hive climate with choices of homes and behaviors but they were not likely to experience serious climatic change other than seasonal changes and short-term ‘weather’. Currently, the movement of colonies across climatic regimes and the storage of bees in controlled environments puts more pressure on the beekeeper in terms of choosing an optimal, or at least tolerable, climate for their bees across the seasons. In the longer term, human impacts on climate trends and extremes will present bees with new challenges and opportunities. A recent paper from the United Kingdom tackles the impacts of climate on honey bee health and provides some short-term predictions for how climate affects disease and the responses beekeepers might make. At the same time, this paper points to the complex soup that reflects disease risk in honey bee colonies and discusses how anticipated changes in the climate might stir that soup.
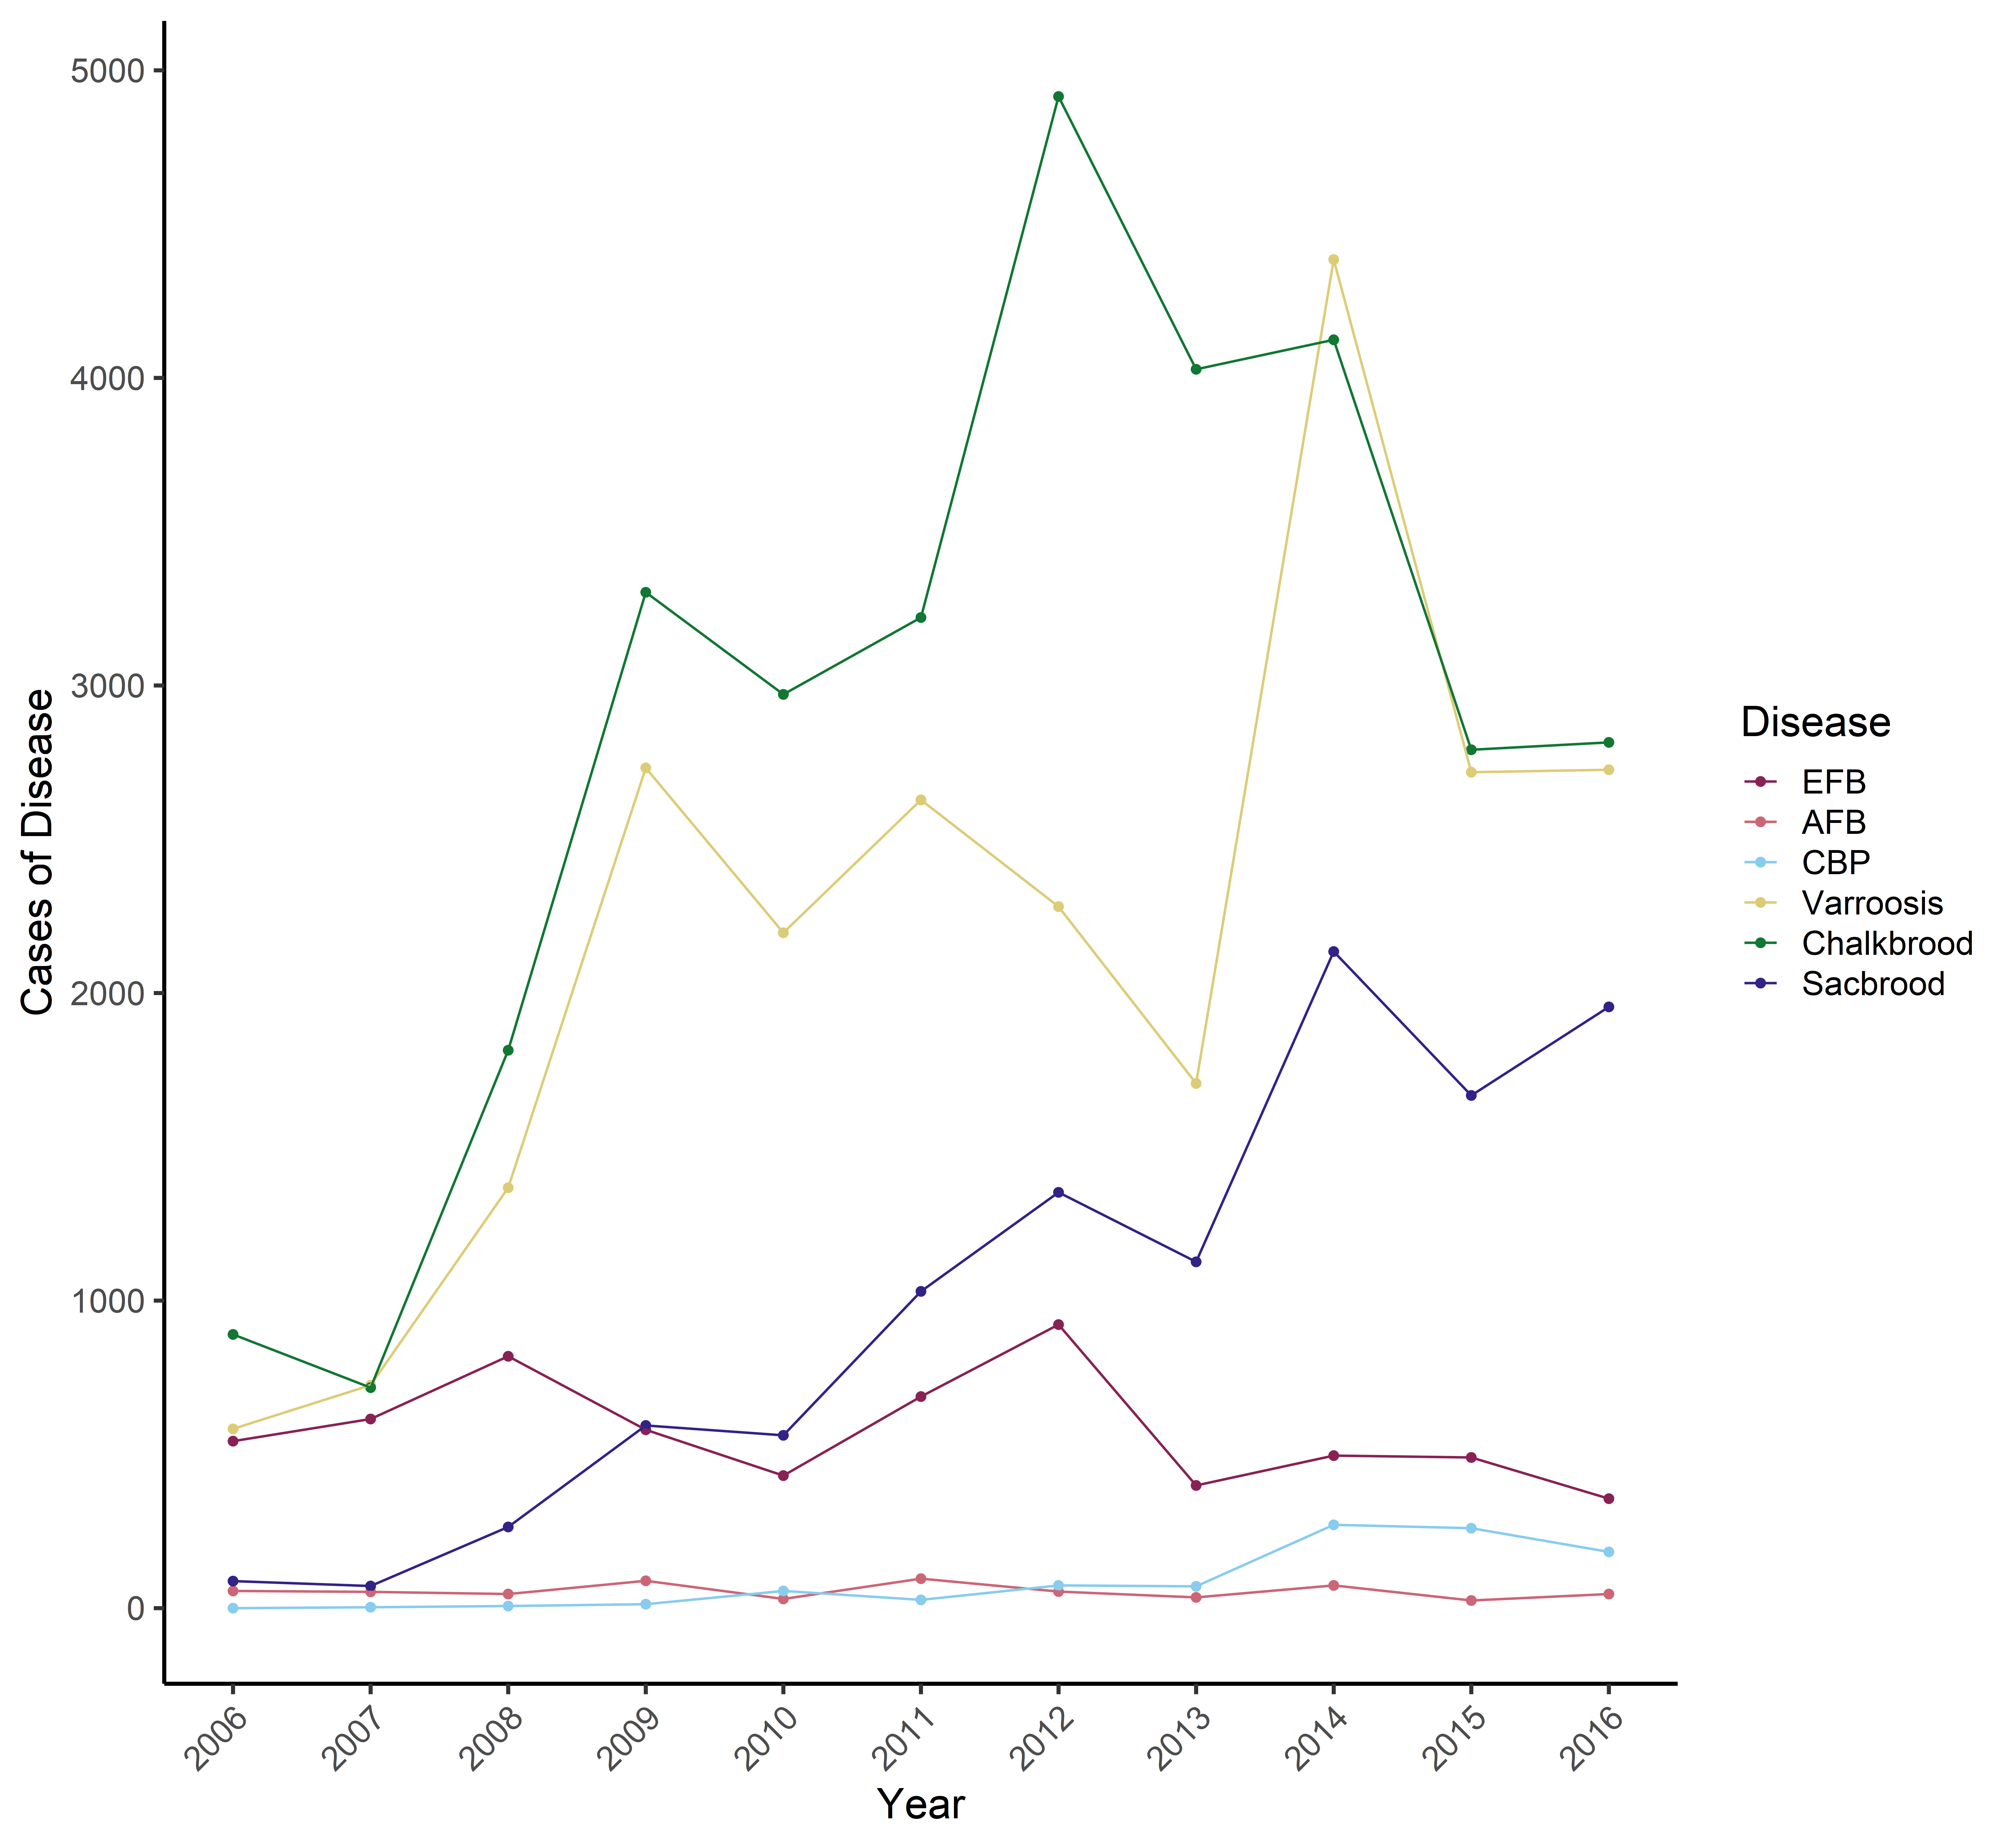
Ben Rowland and colleagues at Newcastle University and the UK’s National Bee Unit dug into a decade of bee disease records in England and Wales and pitted those records against national county-level climate data (Rowland, B.W., Rushton, S.P., Shirley, M.D.F. Brown, M.A, Budge, G.E. Identifying the climatic drivers of honey bee disease in England and Wales Sci Rep 11, 21953 (2021) https://doi.org/10.1038/s41598-021-01495-w). With insights from over 300,000 bee inspector visits and climate data reflecting temperature, wind, and rain, they had a lot of potential connections to explore. They chose to focus on American and European foulbrood, Chronic bee paralysis virus, varroa mites, chalkbrood disease, and sacbrood. Their results corroborate some beekeeper and researcher hunches and also point to areas that need more exploration before management changes are suggested. The two bacterial brood diseases show contrasting patterns. AFB simply plods along, at low frequency and without regard to climate, time or much of anything except for a weak seasonal pattern. As beekeepers have been warned, AFB is a disease of neglect, popping up when frames of symptomatic larvae are left in contact with other colonies… location, location, location. EFB also shows local flareups, often traceable to both neglect and the emergence of new lineages, as shown by prior work from this very group (e.g., Giles Budge and colleagues Molecular epidemiology and population structure of the honey bee brood pathogen Melissococcus plutonius ISME J 8, 1588–1597 (2014) https://doi.org/10.1038/ismej.2014.20). However, EFB also proved to be connected with local weather patterns. Cases of EFB increased with higher rainfall, arguably because bees were confined to the hive..possibly for days on end, since this was England. The authors also argue for a link between protein stress and EFB, since those bees were less able to collect fresh pollen. Interestingly, from this large dataset EFB cases have decreased in the UK over the past decade, and perhaps even the past two decades, despite increased beekeeper concerns with EFB. As in the U.S. (www.apiaryinspectors.org), the UK tightly regulates both AFB and EFB through its inspector programs, arguably helping to keep these diseases in check. In the U.S., true EFB outbreaks are matched by high frequencies of ‘EFB-like’ syndromes, a topic for another day.
Varroa levels were inferred from inspector reports that mentioned ‘bad varroa’, ‘Deformed wing virus’ and ‘parasitic mite syndrome’ along with direct mite counts. Varroa trended up with higher temperatures, perhaps reflecting greater productivity by colonies and hence higher brood numbers for reproducing mites. Varroa also increased over the ten-year span and the authors suggest this reflects increased resistance by mites to chemical miticides. The data also show the expected seasonal changes in varroa numbers, with mites trending up from Spring to Fall. Sacbrood disease showed similar trends to varroa, an odd result since the sacbrood virus is not vectored by mite parasites. Sacbrood was also higher in areas with higher apiary density, likely reflecting the risks of horizontal transfer across apiaries. Interestingly, a second virus, Chronic bee paralysis virus, did not vary with season, density or any climatic measures. This virus only showed a steady increase in frequency over the ten-year period. Finally, chalkbrood disease was more prevalent with lower temperatures and varied significantly by season across the surveyed regions. Chalkbrood also seems to be on the increase in the UK once other variables are accounted for.
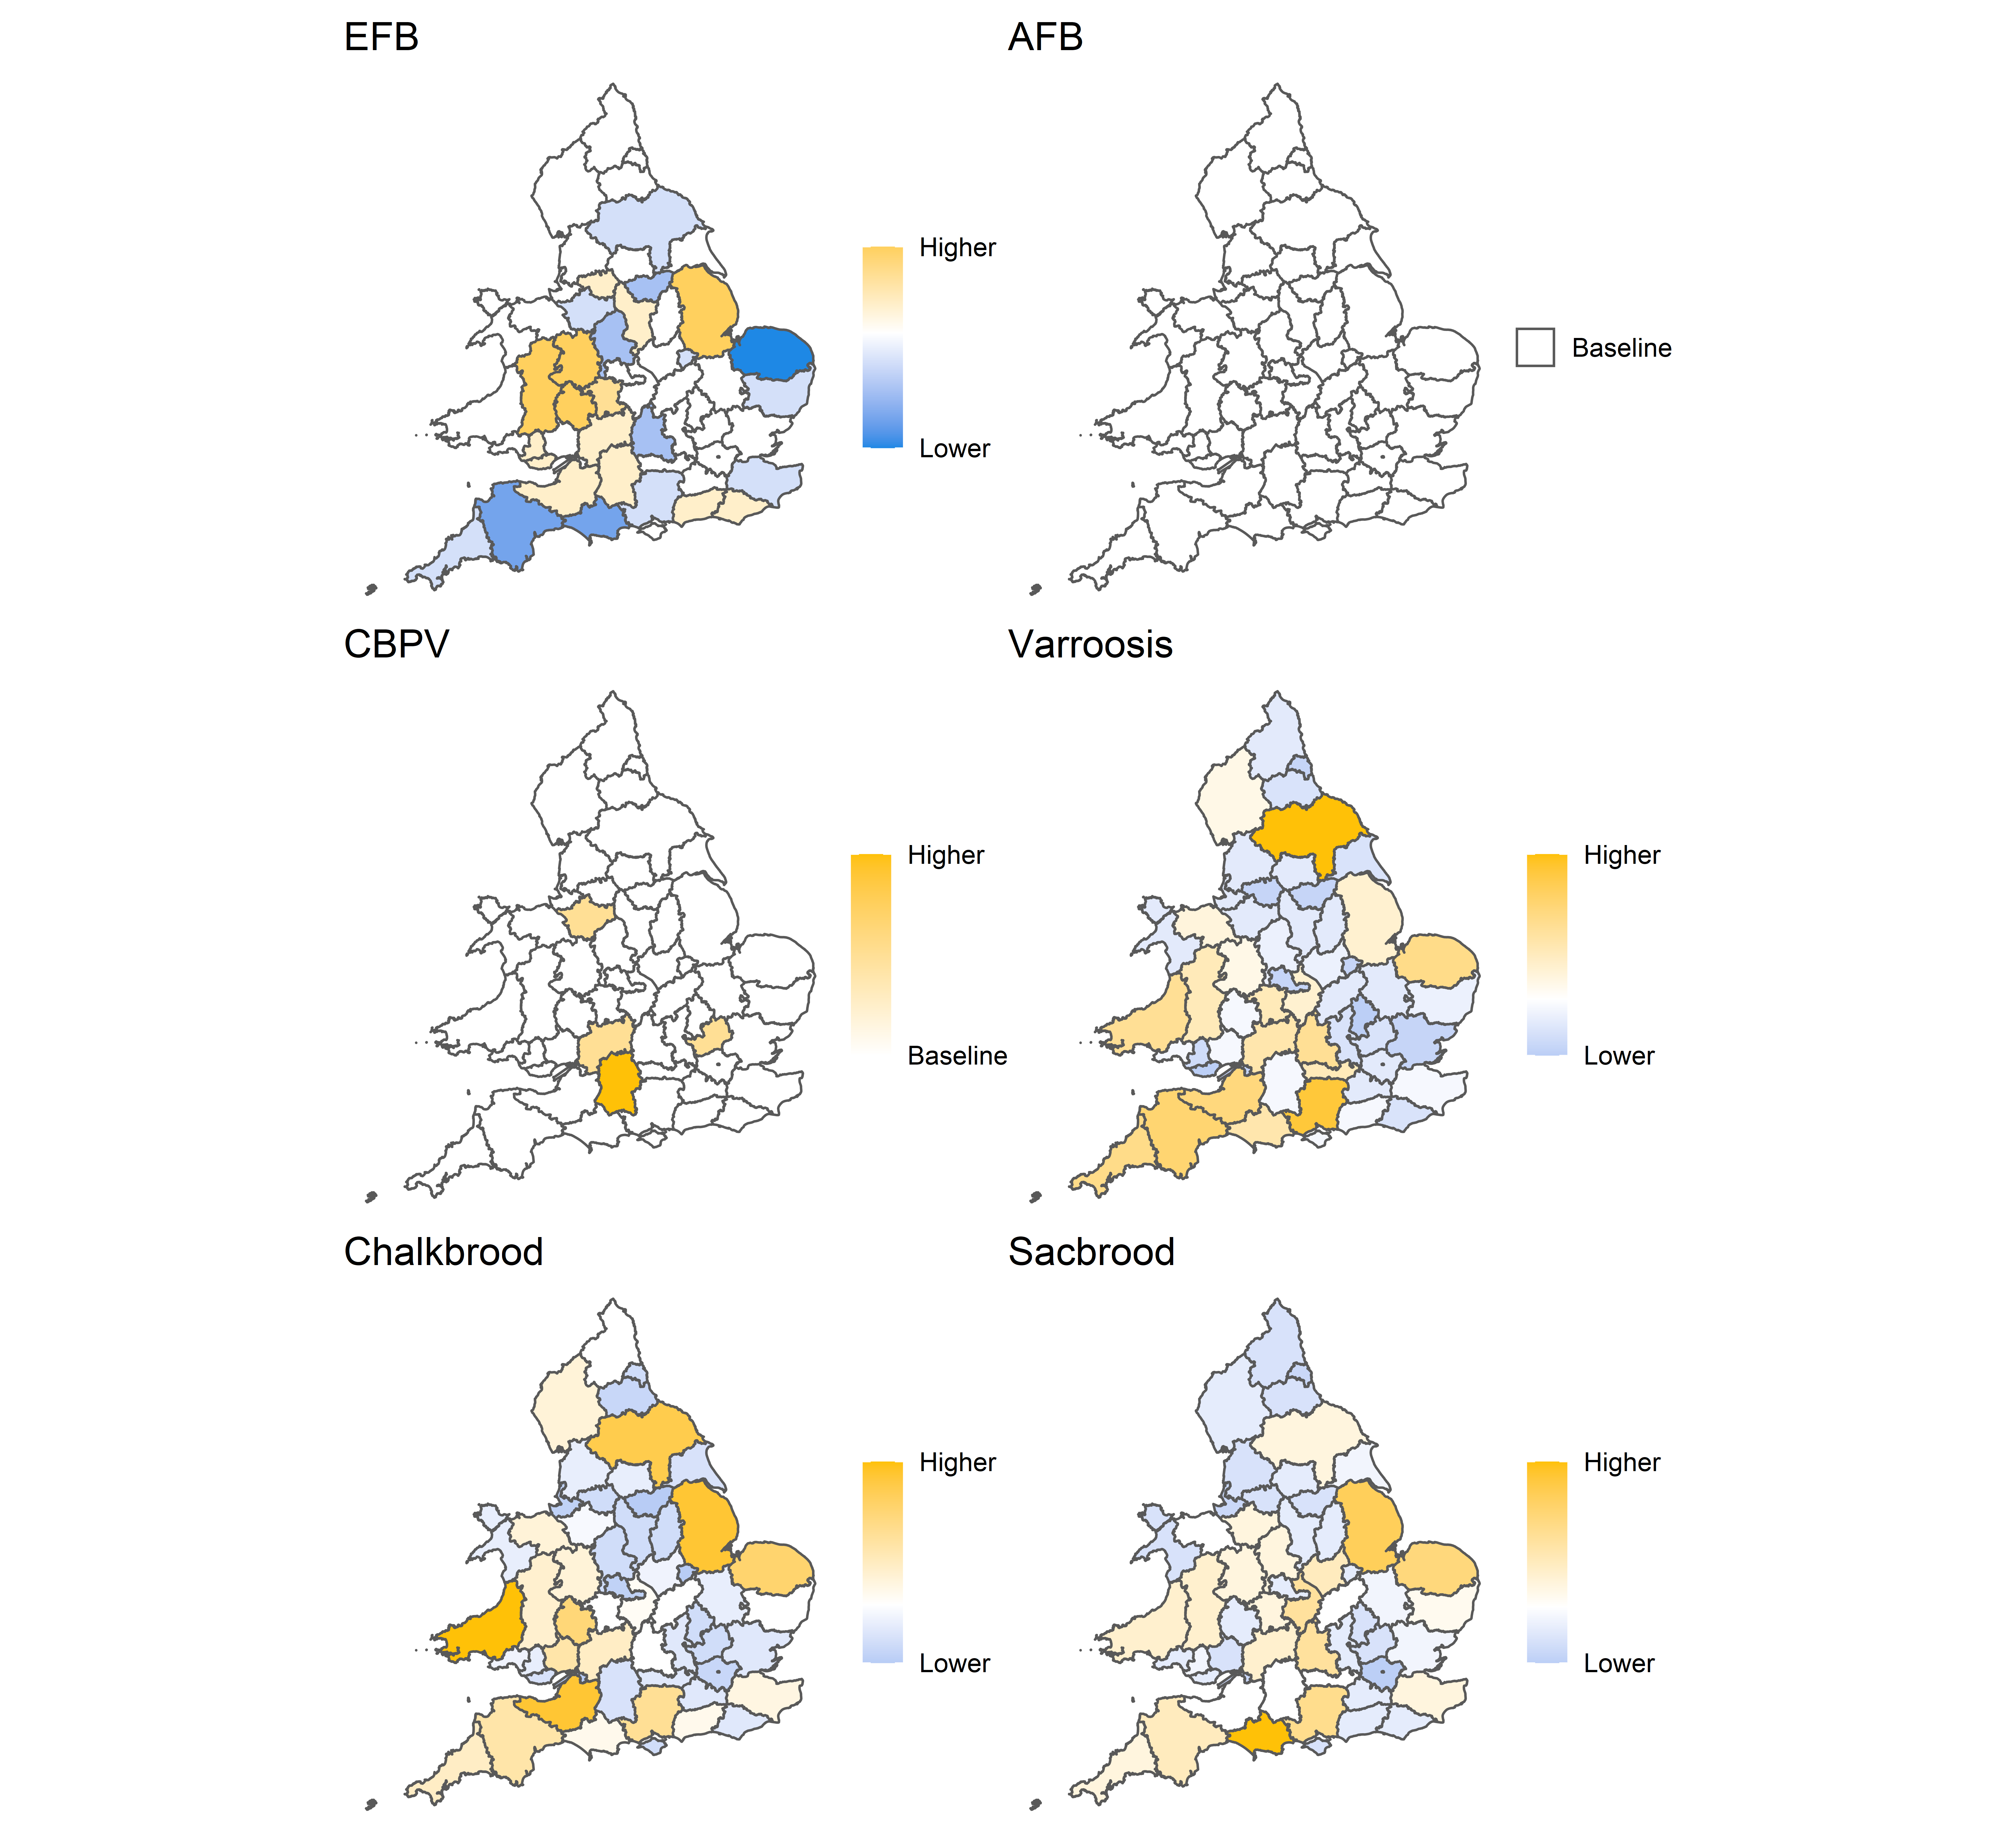 A sobering result from this study (depicted in Figure #4 of the study) is the disconnect between raw inspection data by county and the relative importance of each agent (disease risk) once other confounding connections are ruled out. Observed disease incidents are of course what beekeepers and inspectors act upon and they have huge importance, but to understand what leads to outbreaks (or to escapes by bees of serious disease) one has to simultaneously look at seasons, interactions, and local weather. The key weather effects were found at the point of diagnosis/inspection and for two months prior. Not unexpected and this linkage supports the premise that the measured factors are nearing the correct ones.
A highlight of this study is that they successfully leveraged tons of data collected directly from colonies with ‘the rest of the world’; from economics to satellite images and local weather stations. This connection of big datasets mirrors efforts in the United States from the USDA National Agricultural Statistics Service (https://www.nass.usda.gov/Surveys/Guide_to_NASS_Surveys/Bee_and_Honey/), the Bee Informed Partnership (www.beeinformed.org) and newer efforts such as Beescape (beescape.org). Connecting these diverse sets of information, which will involve computers and some clever soup tasters, will help inform the challenges our bees face in any climate.