


By: William Hesbach
This article originally appeared in the Autumn 2017 issue of BEEKeeping Your First Three Years
Accurate estimation of a colony’s population of varroa is key to assessing its health and determining the need for treatment. Sticky boards, inserted under colonies to capture falling mites,1 are one way of estimating the total population of varroa. They are widely used by both beekeepers,2 and in research3 but even with a long history of use, the interpretation of the data they provide is still a subject of discussion among both beekeepers4 and researchers5.
Sticky boards are unlike other methods used to evaluate a colony’s infestation level. In other methods, like sugar rolls or alcohol washes, a sample of the phoretic mites20 are collected and counted. In those methods, we assume the phoretic mite counts relate to the total population, and the numbers obtained are discussed as if they are. For instance, if we did an alcohol wash on 300 bees and three mites were counted we would say the mite “level” was 1%. It gives us a standard measurement system that works well under almost all conditions.
With sticky boards, the mites collected include those that are groomed off bees, mites that die naturally, and mites that exit from brood cells and fall before they can attach to a bee. Our assumption about sticky boards is that those different mite sources fall to the board at a rate commensurate with the total population influenced by factors like the seasonal brood cycle and the hygienic behavior of the bees.
Because sticky boards are allowed to collect mites for an extended period, some researchers say that the natural drops represent a more accurate assessment of the total mite population. But unlike the other methods, sticky board counts have not been standardized into a single percentage that we can determine just from counting the mites – there’s more to it. Since a sticky board natural drop includes more information, an interpretation that accounts for the all the factors is critical, and fortunately, the science and counting methodology exists.
What follows is a review of some of the science on sticky board natural mite drops and a few illustrations on how they can be used to calculate the total population of varroa. Also, I’ve provided figures and examples to simplify the process used to determine treatment thresholds. Hopefully, after reading, you will be able to interpret a sticky board with confidence and teach others to do the same.
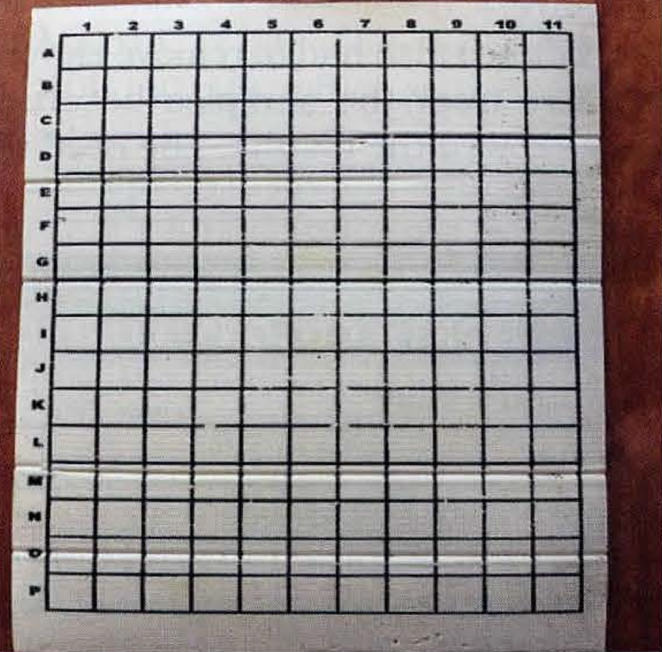
Figure 1. This sticky board is typical of ones purchased from suppliers with grid lines to make counting easier. I uses a small paint roller that fits into a wide mouth Vaseline jar and then roll the surface to make it sticky. They can be cleaned and reused many times.
Sticky Board Basics
Sticky boards are any thin flat material, usually white and waterproof, approximately the same width, and length of the colony being tested that are coated with a sticky substance like Vaseline or cooking spray (Figure 1). In the case of a colony with a screen bottom, the boards can be placed under the colony, or they can be slid in the front entrance of a colony with a solid bottom board. The boards are allowed to remain in place for a specified time, and then the boards are removed, and the mites are counted.(Figure 2) In colonies with high mite counts, the counting can be tedious. In those cases, the counting can be simplified using technics which allow a beekeeper to sample areas of the sticky board and then estimate the total amount of mites on the board3. The next step is to interpret the count, but before that, a little background on the research will help establish a basic understanding of how it’s done.
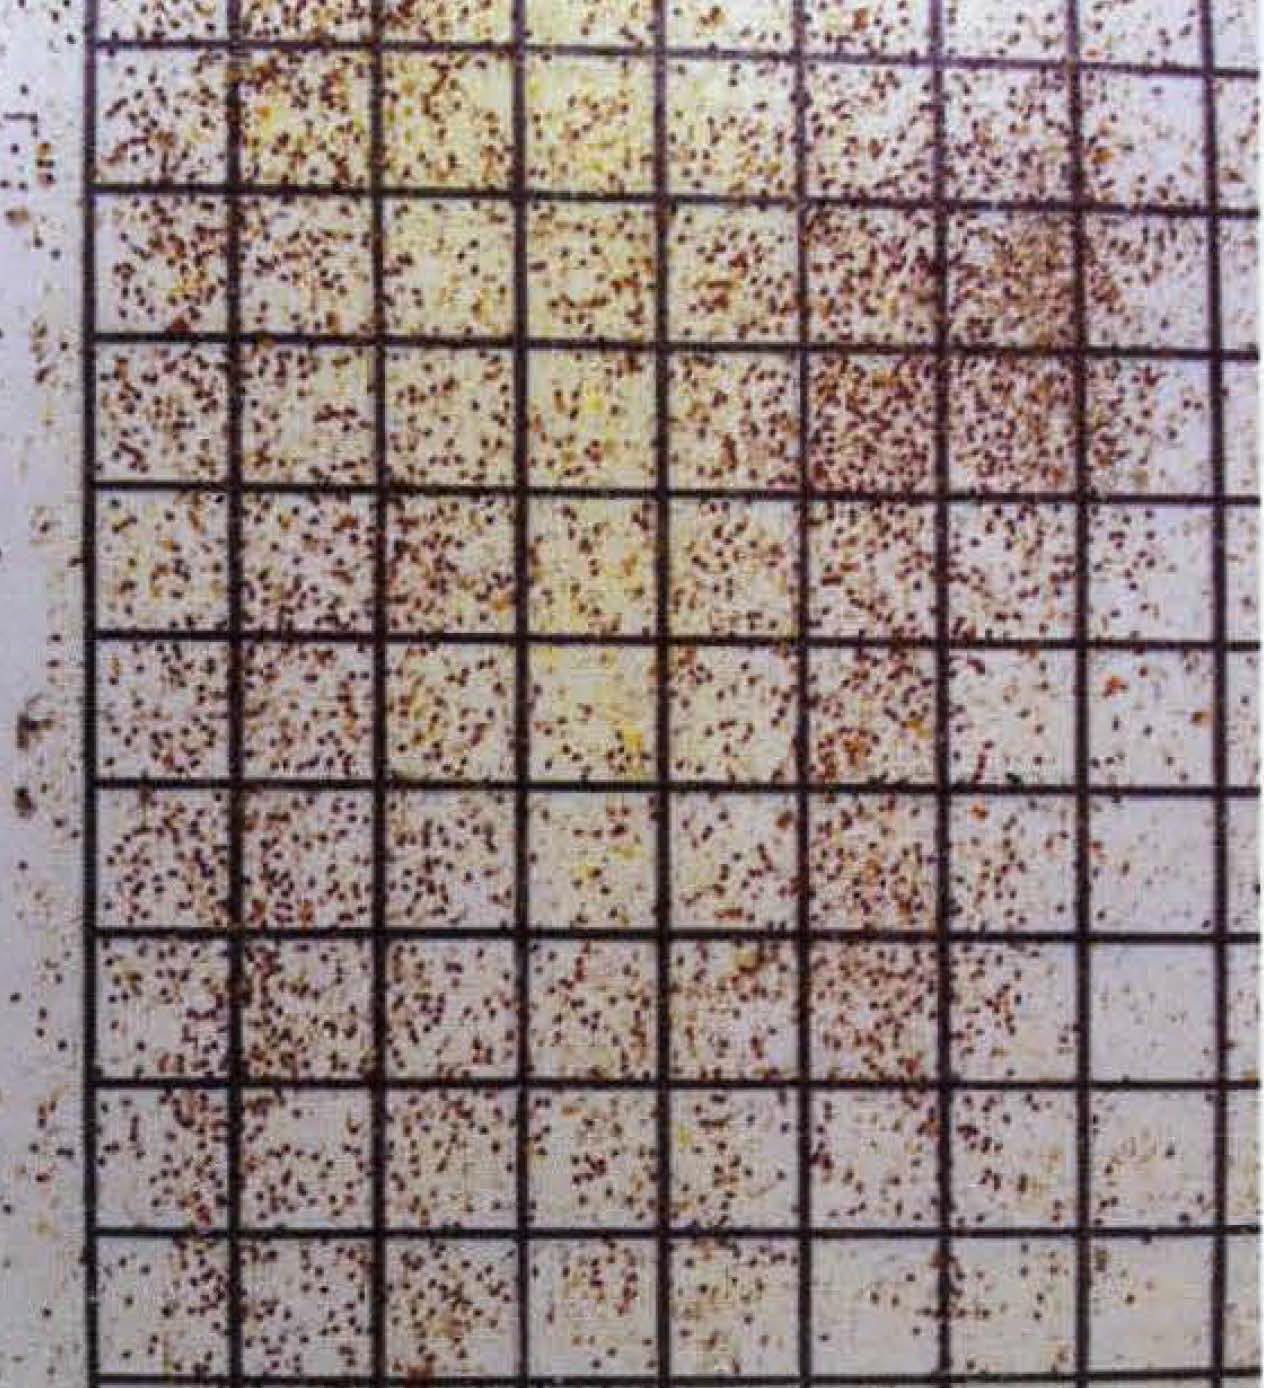
Figure 2. A typical sticky board with detritus and mites.
Background Research
Pivotal in an understanding of what natural mite drops can reveal is outlined in the original work of Steven Martin done in 19988. Martin’s innovation was to build a model that could predict varroa populations using thoroughly researched mite reproduction cycles. Although mite reproduction is a continuing field of research9, contemporary researchers still cite Martin’s original work as an important baseline10, which goes a long way in establishing its lasting credibility. Also, Martin’s implied assumption that a model using individual reproductive behaviors can predict population growth has also been researched and supported, which further validates Martin’s basic premise11.
Martin used the modeling software ModelMaker® for his calculations24. If you refer to Figure 3, you can see the extent to which Martin considered the inputs. Martin included data on average brood reproduction cycles11, mortality data of phoretic mites8, and mite cell invasion data12,13. Martin weighed heavily on the percentage of fertile mites in a colony using 42 studies conducted by various researchers. He also included the number of eggs a foundress mite lays in different cell types and the resulting offspring survival statistics14,15.
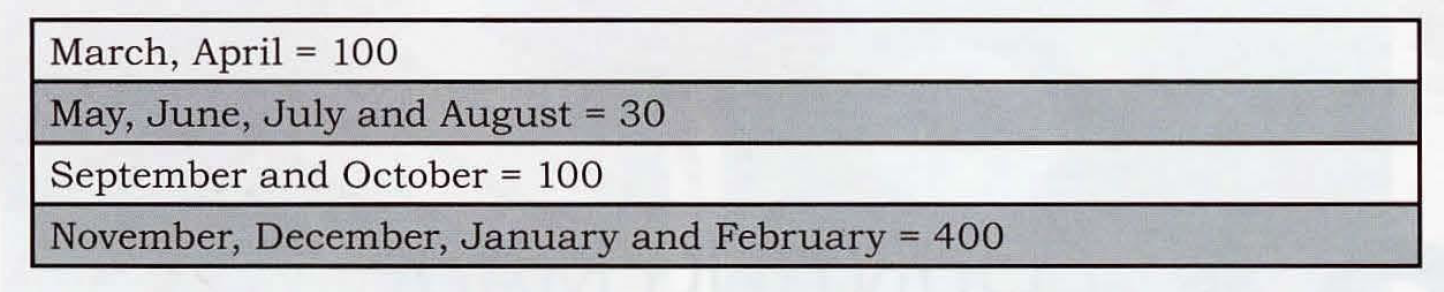
Figure 3. Martin’s basic model structure of the varroa life-cycle. The numbered compartments refer to the various model elements.
The part of his research that has the most practical value to beekeepers is his model’s ability to predict the total live mite population over time plus the daily rate of mite population increase. The model also showed the variation in mite population that occurs seasonally, and Martin claimed that a seasonal multiplier he developed could be used with a sticky board count to estimate the total mite population anytime a count is done.
While a model is a convincing calculation, its accuracy and usefulness depend on the model maker. In this case, Martin seemed to have an informed understanding of population dynamics. But even when a model’s author gets it correct, all models are a simplification18, and as discussed by Rosenkranz et al. (2010), 21 natural systems have a considerable amount of variation. Therefore it’s important to enhance a model with additional research and in particular with relevant field research. Although in Martin’s paper he suggests there was some form of field research, in recent correspondence, he indicated that any field data was likely lost.
Supporting Field Work
In a paper by Branco, et al. (2005)5, the authors compared three sampling methods using 22 live colonies carried out over a two-year period.
The first method in Branco’s study combined the total mite counts from both alcohol washes and from uncapping of brood cells. Based on some earlier science19, combining these two totals was considered a more reliable method than either done separately. Second, natural mite drops using sticky boards were done over five separate one-week periods resulting in 63 independent data samples.
The third sampling method was used to determine the total mite population. By estimating the total mite population, you can mathematically determine the extent to which the data gathered in the first two methods is related to that population. The only way to do that is to kill as many mites as you can and count them. In this study, they used Apistan strips (fluvalinate) which, at the time, were still very effective at killing mites. After the strips had been applied, the dead mites were collected on drop boards and counted weekly for six consecutive weeks. That total six-week count was then considered equal to the entire mite population.
After some regression testing22, the results showed that sticky board drop data could be considered a reliable predictor of the total mite population. In mathematical terms, the datasets showed a high correlation. Branco did not find the same correlation between the combined mite counts from the first method which used alcohol washes and uncapped brood. Also, Branco’s natural drop periods were a week long which gives us our first hint about sticky board drops- the longer they are allowed to collect data the more accurate they are.
Branco also had to remove eleven outliers from the samples because they skewed the results. The need to remove outliers highlights the second major consideration for natural mite drops. The natural mite drops became unreliable when a colony remained broodless, or the colony was collapsing due to parasitic mite syndrome. Sticky boards are not considered accurate if a colony suffers from either of those conditions or any condition that would disturb brood rearing. Therefore, beekeepers using sticky boards should always consider doing a simple inspection beforehand to determine the overall health of the colony.
A more recent field study by Flores et al. (2015)7, designed to test the accuracy of various sampling methods, concluded that a four-day natural drop using sticky boards is all that’s required to obtain a significant correlation to total mite population. Flores tested alcohol washes, powered sugar rolls, and mite samples from uncapping brood cells. In all cases, the only significant correlation to total mite population was the natural mite drop. Flores used a four-day sample because the detritus accumulating on the drop board with longer intervals complicated counting mites. But Flores acknowledges that the longer the sample, the better the reliability. The four-day drop is a good compromise between accuracy and practicality. I’ve done many longer drops and can attest to the fact that hive detritus can make counting very difficult.
Summary
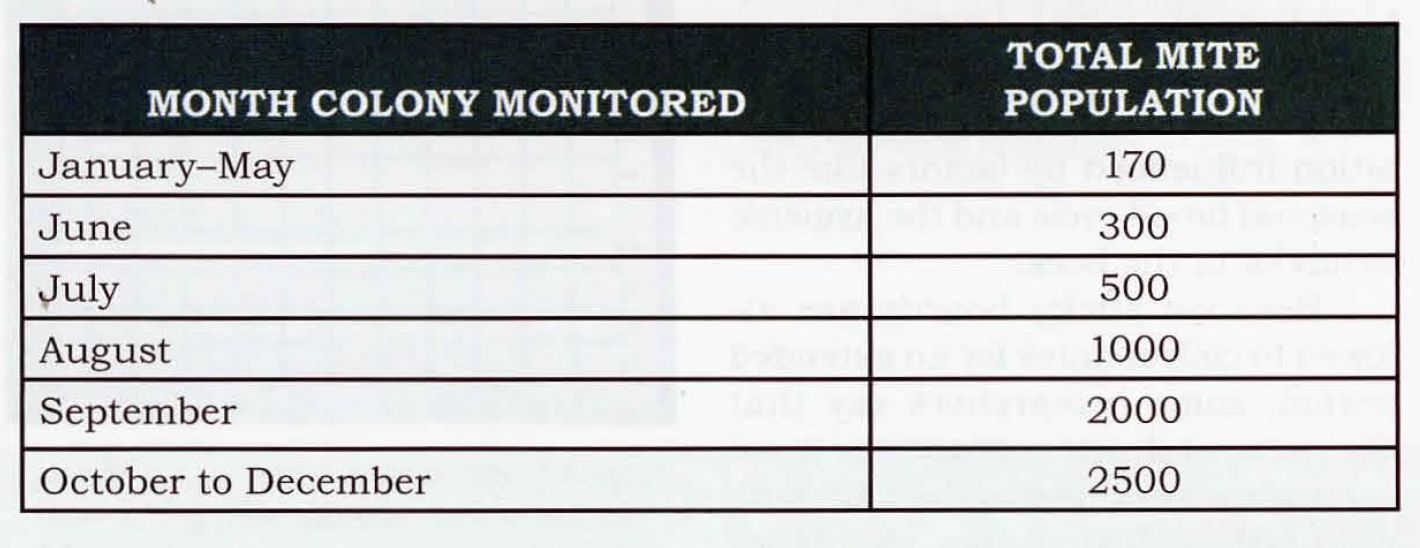
Figure 4. Martin’s daily average drop multipliers by month obtained from his work in 1998. Once a colony’s daily average drop is obtained in any given month, multiplying that average by the number for that month will yield an approximation of the total varroa population.
The original work by Martin, suggests that a simple multiplier can be used to translate the average daily number of mites found on a sticky board into the total mite population. Martin also suggests that the daily average multipliers can be adjusted seasonally to account for the naturally occurring mite and bee brood cycles (see Figure 4). The total mite population can then be used to determine a treatment threshold based on the season (see Figure 5).
As discussed, support of Martin’s hypothesis that natural mite drops correlate with total mite population is found in the work of Branco et al. (2006) and Flores et al. (2015). In both these field studies, mites were allowed to drop naturally, and daily counts were compared to the colony’s total mites population. To determine the total mite population all the mites in the colonies were killed then counted. In each study, linear regression revealed that sticky board natural mite drops are highly correlated with the total population.
How to Use Sticky Board Drop Counts
Here’s one way you could use your sticky board mite counts to determine treatment thresholds using Martin’s multipliers. First, you would do a four-day mite drop and count all the mites, and then that number would be divided by four to get the average daily mite drop. The daily mite drop is the first data point.
Example:
Step 1: If a four-day drop resulted in a 40 mite count, then the daily average drop would equal 40 divided by 4 or 10 mites.
Step 2: Take the daily average drop of 10 and multiply it by the seasonal multiplier found in Figure 4. In this case, we’ll say it’s the month of May. May’s multiplier, according to Martin, is 30. The result would be 300 (30 x 10), which is the second data point.
Step 3: This is just a simple lookup that’s found in Figure 5. In this case, Martin’s threshold for treatment in May is 170 mites. Therefore using this example, with the result of 300 mites, the colony would need treatment.
Doing these three steps is faithful to Martin’s research, but there’s another way to condense the process a little further. If you do the calculations backward meaning starting with the total mite population treatment threshold and then dividing each by its seasonal multiplier, you have a list of the maximum allowable daily drop averages for each month.
For example, using May with a treatment threshold of 170 and dividing by its monthly multiplier of 30, the maximum daily average drop is approximately six. Knowing that you can read a treatment threshold right off the drop board. If you do a four day drop the natural mite fall for the entire drop period must be less than 6 x 4, or 24 mites. You can do the same calculation for any total drop.
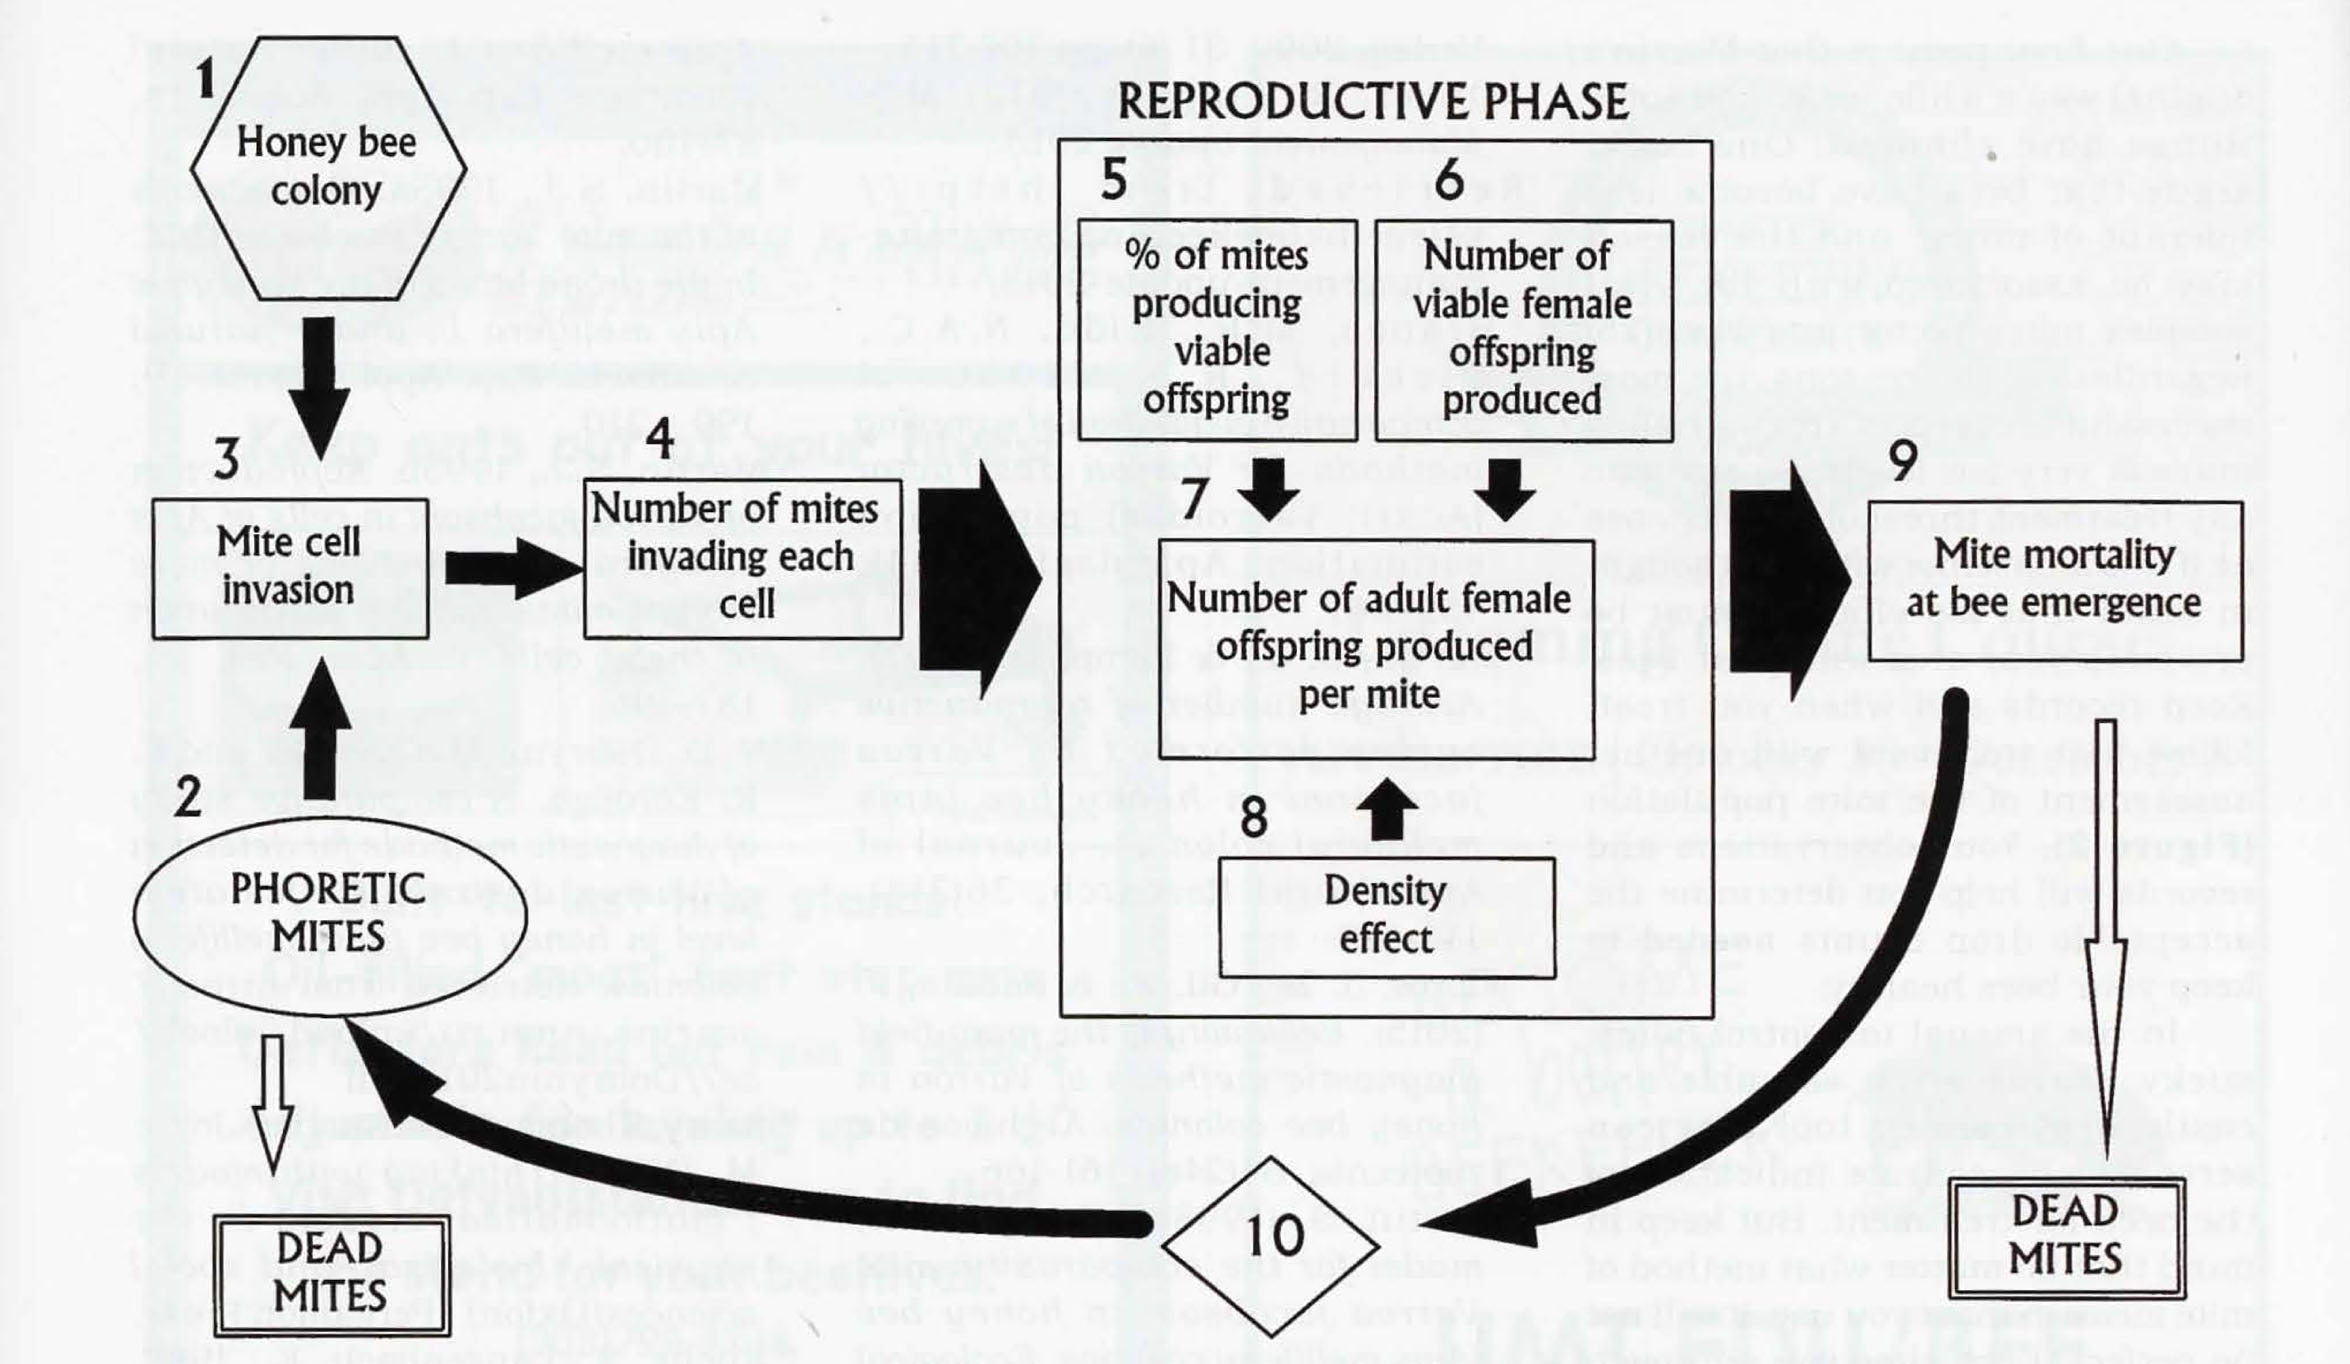
Figure 5. *Treatment threshold values were obtained from a separate paper by Martin, (Martin, S. (1998b). Varroa jacobsoni: monitoring and forecasting mite populations within honey bee colonies in Britain. MAFF). Martin’s total mite population treatment thresholds establish that no treatment is needed as long as the total mite population is below the number listed for each month. Total mite populations are calculated by multiplying daily drop averages by the monthly multiplier.
One final point is that Martin’s original was a while back, and some things have changed. One could argue that bees have become less tolerant of mites, and the reason may be associated with the viral complex mites vector into bees25. Regardless of the reasons, the most successful beekeepers are controlling mites at very low levels. So evaluate any treatment threshold you choose as if it is a baseline with the thought in mind that it’s efficacy must be proven in your area with your bees. Keep records and when you treat, follow that treatment with another assessment of the mite population (Figure 2). Your observations and records will help you determine the acceptable drop counts needed to keep your bees healthy.
In the arsenal to control mites, sticky boards are a valuable and easily implemented tool that can serve as an accurate indication of the need for treatment. But keep in mind that no matter what method of mite measurement you use, it will not be perfect. Each time you approach your apiary, you’re engaged with a complicated biological system that requires both judgment and art to manage, and even then will not yield easily no matter how much we wish it would. Your success as a beekeeper will always depend on your skill to observe the present conditions and take action. Treat your bees as if their existence depends on your care – because it does.
Bill Hesbach is an EAS Certified Master Beekeeper and a graduate of the University of Montana’s Master Beekeeping program. He and his wife Elizabeth own and operate Wing Dance Apiary in Cheshire, CT.
Citations and Notes
1 Parkman, J.P., Skinner, J.A. and Studer, M.D. 2002. The Tennessee Varroa sticky board trap. Bee Culture, 130: 30-33.
2 Oliver, R. (2006) IPM 4 Fighting Varroa4: Reconnaissance Mite sampling methods and thresholds. Retrieved from http://scientificbeekeeping.com/fightingvarroa-reconnaissance-mitesampling/
3 Nancy Ostiguy, Diana Sammataro. A simplified technique for counting Varroa jacobsoni Oud. on sticky boards. Apidologie, Springer Verlag, 2000, 31 (6), pp.707-716.
4 Oliver, R. (August 2013) Mite Management Update 2013. Retrieved from http://scientificbeekeeping.com/mitemanagement-update-2013/
5 Branco, M.R., Kidd, N.A.C., Pickard, R.S., 2006. A comparative evaluation of sampling methods for Varroa destructor (Acari: Varroidae) population estimation. Apidologie 37 (4), 452-461.
6 Martin, S. J., & Kemp, D. (1997). Average number of reproductive cycles performed by Varroa jacobsoni in honey bee (Apis mellifera) colonies. Journal of Apicultural Research, 36(3-4), 113-123.
7 Flores, J. M., Gil, S., & Padilla, F. (2015). Reliability of the main field diagnostic methods of Varroa in honey bee colonies. Archivos de zootecnia, 64(246), 161-166.
8 Martin, S. (1998a). A population model for the ectoparasitic mite Varroa jacobsoni in honey bee (Apis mellifera) colonies. Ecological Modelling, 109(3), 267-281.
9 Huang, Z. (2012). Varroa mite reproductive biology. American Bee Culture http://www.extension.org/pages/65450/varroa-mite-reproductivebiology.
10 Lee, K. V., Moon, R. D., Burkness, E. C., Hutchison, W. D., & Spivak, M. (2010). Practical sampling plans for Varroa destructor (Acari: Varroidae) in Apis mellifera (Hymenoptera: Apidae) colonies and apiaries. Journal of Economic Entomology, 103(4), 1039-1050.
11 Sumpter, D. J. T., & Broomhead, D. S. (2001). Relating individual behaviour to population dynamics. Proceedings of the Royal Society of London B: Biological Sciences, 268(1470), 925-932.
12 Boot, W. J., Sisselaar, D. J., Calis, J. N., & Beetsma, J. (1994). Factors affecting invasion of Varroa jacobsoni (Acari: Varroidae) into honeybee, Apis mellifera (Hymenoptera: Apidae), brood cells. Bulletin of Entomological Research, 84(01), 3-10.
13 Boot, W.J., Schoenmaker, J.N.M., Calis, J.N.M., Beetsma, J., 1995a. Invasion of Varroa into drone brood cells of the honeybee, Apis mellifera. Apidologie 26, 109-118.
14 Martin, S.J., 1994. Ontogenesis of the mite Varroa jacobsoni Oud. In worker brood of the honeybee Apis mellifera L. under natural conditions. Exp. Appl. Acarol. 18, 87-100.
15 Martin, S.J., 1995a. Ontogenesis of the mite Varroa jacobsoni Oud. In the drone brood of the honeybee Apis mellifera L. under natural conditions. Exp. Appl. Acarol. 19, 199 – 210.
16 Martin, S.J., 1995b. Reproduction of Varroa jacobsoni in cells of Apis mellifera containing one or more mother mites and the distribution of these cells. J. Apic. Res. 34, 187-196.
17 N. D. Dobryni, M. Colombo and F. R. Eordegh. A comparative study of diagnostic methods for detection of Varroa destructor infestation level in honey bee (Apis mellifera) colonies. Retrieved from https://acarina.utmn.ru/upload/iblock/ce7/Dobrynin2013.pdf
18 Saaty, Thomas L. Alexander, Joyce M., 1981. Thinking with models: mathematical models in the physical, biological, and social sciences. Oxford; Pergamon Press.
19 Fuchs, S., Langenbach, K., 1989. Multiple infestation of Apis mellifera L. brood cells and reproduction in Varroa jacobsoni Oud. Apidologie 20, 257-266.
20 Phoretic means an association between two species in which one transports the other, for example when a mite attaches to a bee and is carried to larva on the bee’s exoskeleton. In this state, they are exposed and can be removed and counted using powdered sugar shakes or alcohol washes.
21 Rosenkranz, P., Aumeier, P., & Ziegelmann, B. (2010). Biology and control of Varroa destructor. Journal of invertebrate pathology, 103, S96-S119.
22 If you want to learn a little more about the math, see this website: http://www.biostathandbook.com/linearregression.html
23 Martin, S. (1998b). Varroa jacobsoni: monitoring and forecasting mite populations within honey bee colonies in Britain. MAFF.
24 ModelMaker®, 1994. Cherwell Scientific Publishing, Oxford, UK. Internet: www.apbenson.com/cherwell-scientific
25 Francis, R. M., Nielsen, S. L., & Kryger, P. (2013). Varroa-virus interaction in collapsing honey bee colonies. PLoS One, 8(3), e57540.