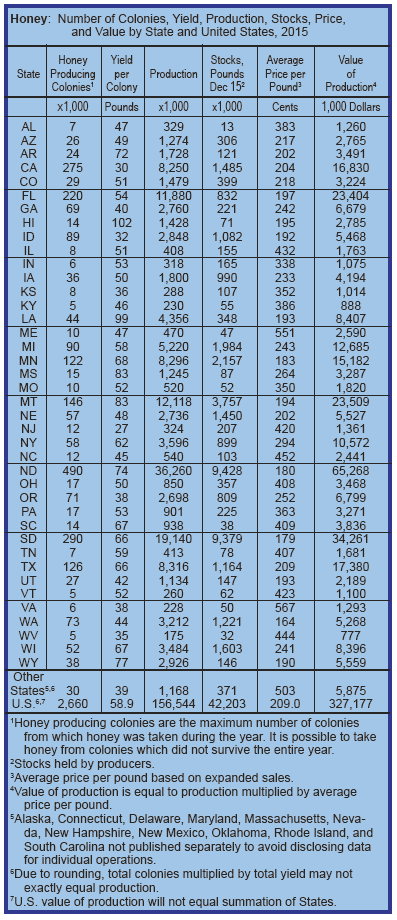
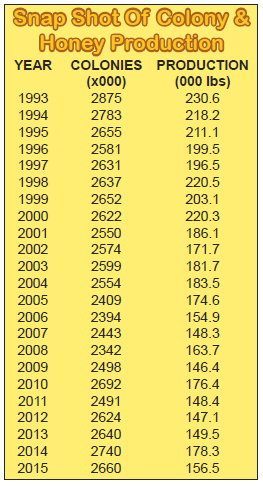
According to USDA NASS survey data, United States honey production for 2015 was down 12 percent from 2014 for operations with five or more colonies at 157 million pounds. There were 2.66 million colonies from which honey was harvested in 2015, down three percent from 2014. Yield of honey harvested per colony averaged 58.9 pounds, down 10 percent from the 65.1 pounds in 2014. Colonies which produced honey in more than one State were counted in each State where the honey was produced.
Therefore, at the United States level yield per colony may be understated, but total production would not be impacted. Colonies were not included if honey was not harvested. Producer honey stocks were 42.2 million pounds on December 15, 2015, up two percent from a year earlier. Stocks held by producers exclude those held under the commodity loan program, which were at 4.8 million pounds on December 1, 2015.
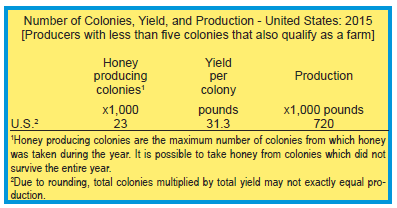
New this year is survey data of honey production in 2015 from producers with fewer than five colonies which totaled 720 thousand pounds. There were 23 thousand colonies from which honey was harvested in 2015, for an average yield of 31.3 pounds harvested per colony. This yield is 27.6 pounds less than what was pulled per colony on operations with five or more colonies. Comparisons to 2014 are unavailable because no data prior to 2015 was collected for operations with fewer than five colonies.
We’re feeling just a tad smug this month because of the predictions we made back in November, 2014, four months before NASS released their numbers. Back then, using data we gathered from our Monthly Honey Report reporters, we predicted the number of colonies in each region and about how much honey would be produced in each region, resulting in a yield/colony in each for the year 2015. Colony counts provided by our reporters by region indicated to us that total colonies of beekeepers with more than five colonies would come to 2.65 million colonies. NASS, in March this year from their survey numbers indicated there were 2.66 million colonies. We were off their count by less than a third of one percent. We missed it last year by just over three percent.
We also calculated per colony yields by region coming up with an average figure of 60.3 pounds per colony, and, using our colony count figures, arrived at a total U. S. honey crop for 2015 of 159.9 million pounds. NASS figures of 58.9 pounds per colony, with total U.S. crop of 156.5 pounds were remarkably similar to ours. Last year we were under by about 20% but for all intents and purposes, our colony count and per colony production this year were dead on, and we missed total crop by only 2.1%. So for those of you who just can’t wait until that March date when NASS releases their previous year’s figures, tune in to Bee Culture’s predictions in November for an early statistics fix that seems to be getting more reliable.

But fortunately, NASS has received some additional funding and is expanding their reach in both the frequency and type of reports they will be doing in the future. They’ve begun making quarterly reports on colony losses during each quarter, colony movements for migratory beekeepers, and colony counts – all on a three month basis. Bee Culture has already received the first quarterly survey, covering the months of January, February and March, and the results of that will be released in May, shortly after you get this magazine, so watch the NASS web page for those data.
New this year from the NASS report was data from beekeepers with fewer than five colonies. This was qualified a bit because to be counted you also had to qualify as a farm, which means that many backyard beekeepers wouldn’t qualify. Though it leaves out many who do have colonies and are active in the industry, it does make it simpler to identify this group and keep the data consistent from year to year. Something like 20,000 beekeepers are in the data base I believe, and, like most volunteer surveys, there isn’t a 100% return when surveys are sent out. NASS is persistent however, and if a survey wasn’t returned, a phone call was made, and then another phone call was made, so overall cooperation wasn’t too bad I’m told.
So this new group added to the mix a bit by increasing overall colony count by 23,000, and adding nearly a quarter million pounds of U.S. produced honey to the pot.
Another predictor that seems overlooked is the National Honey Board’s collected assessments by month report found on their web page. So, we went looking.
Back in 2012, the USDA AMS held a vote on reforming the Board, changing it from a honey producer funded board to a honey importer, packer and handler funded board. The process of collecting a penny a pound for honey handled, imported or packed remained the same. So we went back to 2013, the first full year this was in place and looked at both domestic and foreign assessments and USDA data. Packers, importers and handlers that deal with less than 250,000 pounds a year are exempt from paying the assessment so their data isn’t captured here. Nevertheless, based on the assessments collected, we calculated the pounds of honey that the Honey Board was responsible for.
2013 (assessment of $0.01/lb)
NHB Domestic Production USDA Domestic Production
112,239,000 lbs. (= 75% USDA) 149,499,000 lbs.
NHB Imports USDA Imports
332,170,800 lbs. (= 98% USDA) 338,247,220 lbs.
2014
NHB Domestic Production USDA Domestic Production
134,270,000 lbs. (= 75% USDA) 178,270,000 lbs.
NHB Imports USDA Imports
359,200,600 lbs. (= 98% USDA) 366,222,386
2015 (assessment changes to $0.0125/lb)
NHB Domestic Production USDA Domestic Production
127,279,920 lbs. (= 81% USDA) 156,544,000 lbs.
NHB Imports USDA Imports
371,760,080 lbs. (= 96% USDA) 387,865,146 lbs.
Looking at the NHB data it’s obvious that, though not exact, a fairly reliable prediction can be made here, also. NHB data is released at the end of the month, so annual totals for both domestic and imported honey can be made in early January. If you tracked this on a month by month basis, however, the reliability breaks down because of harvest times, short term pricing and other factors. But for a 12 month period it works fairly well. One wonders if this could be leading to (and may be already in some businesses) a futures market for this crop, not unlike January corn, or December soybeans. We can’t imagine this is the first time this has been looked at by buyers of significant quantities of honey.
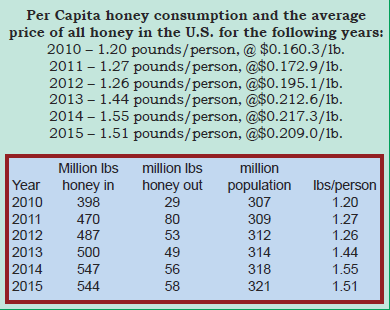
Bee Culture Magazine’s annual computation of U. S. per capita consumption of honey is based on data obtained from USDA NASS, USDA AMS, The Farm Service Agency, and The Census Bureau. Consumption is computed by calculating how much honey came into the US during 2015 which includes in-country production, remaining stocks from the previous year and imports, then figuring how much was removed or wasn’t used, which includes exports, honey in stocks left over and still in warehouses, and honey put under loan and not removed, which leaves total consumption for the year. Then, using the U. S. Resident population as of July 1, 2015 (this July date is used each year to standardize the figure), consumption pounds are divided by resident population to determine the per person consumption for
the year.
Honey in = 156.6 million lbs. domestic, + 387.9 million lbs. imported + 0 lbs remaining in stocks = 544.5 million lbs.
Honey out = 42.2 million lbs. put into stocks, + 4.8 million lbs. loan, +11.2 million lbs. exports = 58.2 million lbs.
544.5 – 58.2 = 486.3 million lbs. consumed in the U. S. in 2015. We examine imports in much more detail below, but for the moment, look at these two numbers – 387.9 million pounds of honey imported last year, and 486 million pounds consumed. What that means is that fully 80%, let’s repeat that, 80% of the honey consumed in this country last year was imported. That’s right, 80%. See below for more on imports last year.
But for now, divide total consumption – 486.3 million pounds by 321 million people on July 1, 2015 = 1.51 lbs. of honey consumed per person in 2015.
2015 Imports
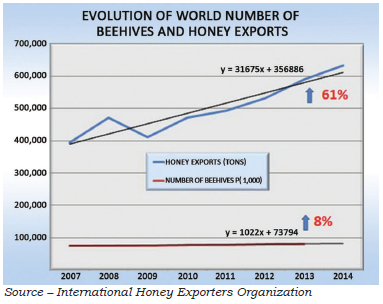
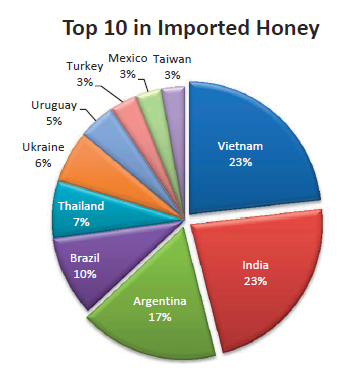 Most noticeable, and most distressing about imports this year, is the fact that we consumed 4.86 million pounds of honey last year, and we imported 3.88 million pounds of honey last year (it was 3.66 million the previous year). So, numbers don’t lie folks, 80% of the honey consumed here last year came from off shore. 80%! It was 66% the previous year. Now NASS doesn’t consider all the honey made by backyard beekeepers and given away, sold at work and the like, so we know some goodly amount isn’t counted in that consumption figure, but then look at the amount produced by those that were counted and you can figure that they didn’t miss all that much. We have to believe there is a positive and lucrative market for U.S. produced honey that isn’t being tapped. Many, but not all grocery store sold honeys, those that are branded as opposed to generic store brands, claim U.S. origin, but you have to look for it on the labels. Bottles with foreign origin are labeled as such for country of origin law, for instance, product of CA, UR, AR (carefully hidden in black ink on the curve of the bottle top) and are almost impossible to identify, and you have to know where to look (there’s pride in your product, right?). Not long ago I stood in the honey isle of a local grocery store and watched people purchase bottles of honey. I asked every customer where did the honey come from and every one said ‘I don’t know, I look at the price, and I don’t care.’ Every one. I asked if they ever bought from a local beekeeper and to a person they said, I don’t know a local beekeeper or I’d buy from him. Farm market? Never go, stuff costs too much. So, I guess, the market is what it is.
 Vietnam and India led the way in providing us with honey last year. Just those two countries supplied a third of all the honey eaten here last year – 162 million pounds. Not too close was Argentina supplying 12%, with the rest of the big 10 offering just over 50% combined.
The other 500 pound gorilla in the honey industry certainly is China. Officially we imported only a couple of tons of Chinese honey last year, the question of where is all the rest is frequently asked.
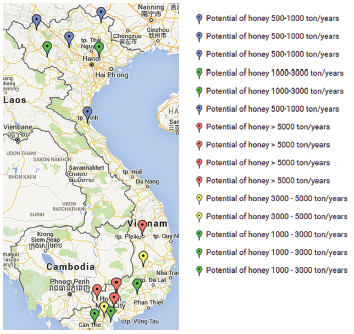
Vietnam leads the way, just, much of which is produced in the far north, capable of producing up to 9,000 tons a year, but much more in the south, with a 36,000 ton possibility. The U.S. is one of their biggest customers bringing in over 40,000 tons last year.
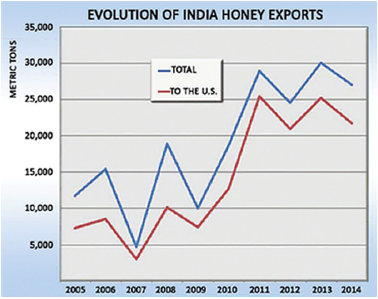
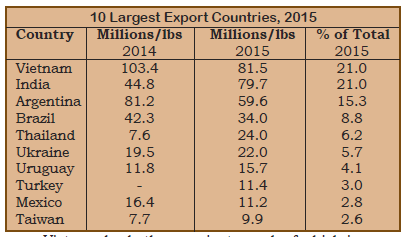 There are easily found reports on the web published in India that some of India’s honey is blended with imported Chinese honey and then exported, while in February this year, newspaper accounts of adding sugar to honey were common place for honey sold in that country. And in past years India’s honey has not held up to scrutiny for being as natural as claimed, but they have been increasing exports steadily so equaling Vietnam’s contribution isn’t surprising. Argentina supplied about 60 million pounds and Brazil, all mostly sold as organic, supplied nearly nine million pounds.
That 80% of consumed honey is imported, the potential for U.S. premium honey commanding a premium price should, but isn’t, appearing. In fact, the much cheaper imports are driving down prices beekeepers are receiving, while costs to maintain colonies continue to increase, mostly driven by feeding and Varroa control.
The Top 10 Producing States
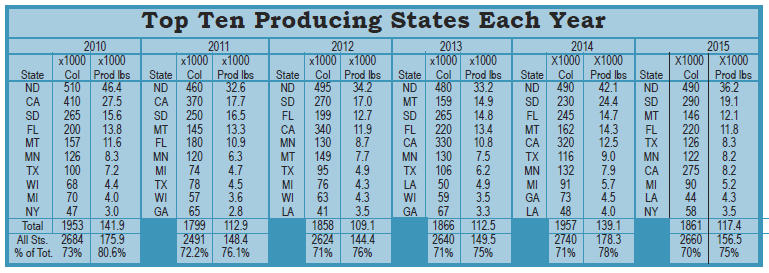
It’s still true. You want to make a honey crop, these are the places to go. The top 10 jockey for position each year, with only the bottom three ever changing. That happened this year, with Georgia dropping off from position nine last year to off the list this year. New York jumped up to the top ten this year for the first time since 2010 with a similar crop again. Combined these 10 states command 70% of all the colonies counted in the U.S. and fully 75% of the honey produced here. And of course North Dakota is the 500 pound gorilla when it comes to both colonies and production. With almost 20% of the colonies in the U. S. and 23% of the U.S. crop produced there they pretty much command the board.
However, migratory beekeeping being what it is, and getting more pronounced, it will be interesting to see what the NASS quarterly reports show with movement during off honey seasons. Reports this year indicated Florida had far, far more than their reported 220,000 colonies during the Winter when being in North Dakota isn’t all it’s cracked up to be than was reported in the NASS count.
Honey Prices
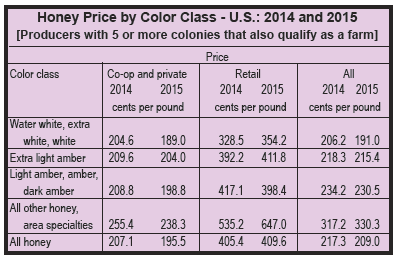
United States honey prices decreased during 2015 to 209.0 cents per pound, down four percent from a record high of 217.3 cents per pound in 2014. United States and State level prices reflect the portions of honey sold through cooperatives, private, and retail channels. Prices for each color class are derived by weighting the quantities sold for each marketing channel. Prices for the 2014 crop reflect honey sold in 2014 and 2015. Some 2014 honey was sold in 2015, which caused some revisions to the 2014 honey prices. Price data was not collected for operations with fewer than five colonies.
Prices were pretty much down across the board last year. Co-op was down just over 5%, retail interestingly was up just a hair but it was up, and all honeys combined down about 4%. That retail prices were up, and pretty much the rest were down, tells us that the margins on less expensive imported honeys are doing just fine, thank you, and consumer indifference and amounts imported support that belief. The National Honey Board is charged with marketing honey, not U. S. honey, and, since it’s organized and operated by packers and importers, the future market for U. S. produced honey appears less than favorable.
The Future
Quarterly surveys by NASS already begun will definitely add to the accuracy of these reports, and we applaud these changes. Better figures will only help beekeepers, growers and even beekeeping supply companies plan accordingly. Counting those with five or fewer colonies will begin to give a handle on this group, too, and that’s good.
Perhaps those who need, or want to know will begin using these figures with a bit more confidence, and, if they are smart, they’ll begin incorporating NHB figures into their equations so they can make better marketing decisions.
What is distressing however, is the trend toward the production of less and less U. S. honey. Absolutely planning on honey income is a gamble and lately an even bigger gamble than many are willing to make. Weather and to a degree labor are the unknowns any more, where it used to be prices. Now, prices are predictable and the steady, but slow decline make that decision even easier. Pollination is king. Long live pollination.


